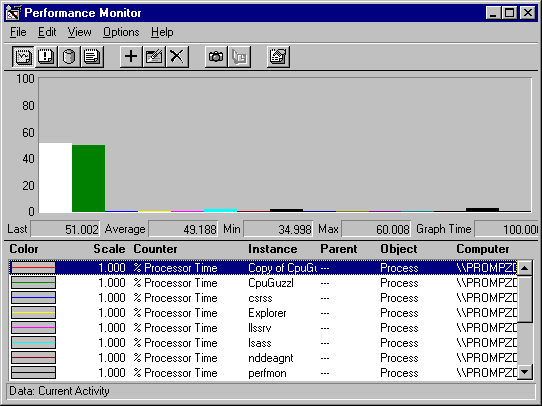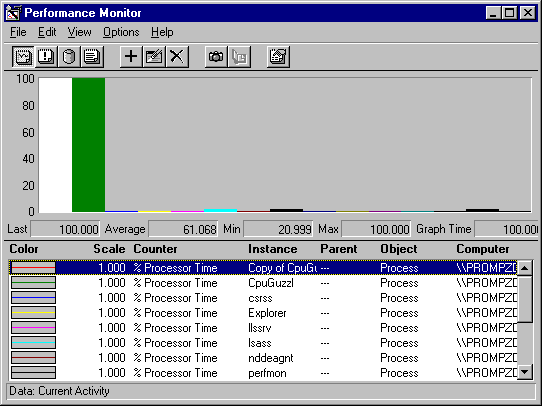
The following figures use histograms of the Process: % Processor Time counter to compare two active processes running on one processor to the same processes running on two processors.
The first graph shows the processes running on a single processor computer. Each process is getting about half of the processing time. All other processes are nearly idle.

The following figure shows the same processes running on a computer with two processors.

On the multiprocessor computer, each process is using 100% of a processor, and the system is doing twice the work. The processor time is the same as for a single process with a single processor all to itself.
However, to achieve this performance, the processes had to be entirely independent; the only thing they shared was their code. Each processor had a copy of the code in its primary and secondary memory caches, so the processes didn't even have to share physical memory or any common system resources. This is the ideal, simulated by CpuStress, a test tool designed for the purpose.