The System: Processor Queue Length counter shows how many threads are contending for the processor. Threads are considered to be in the queue if they are in the Ready thread state, but not running. (Thread states are discussed in more detail later in this section.) Processor Queue Length is part of the System object, not the Processor object, because there is a single queue even when there is more than one processor.
Tip
Start a Performance Monitor alert on System: Processor Queue Length. Set it to report an alert if the queue is over 2 and to log the alerts to the Event Viewer application event log. Review the alert panel and the logs frequently for patterns of activity that produce long queues.
Note
In Windows NT versions 3.5 and earlier, the Processor Queue Length counter did not work until a thread counter was added to the chart, log, or report. This was fixed in version 3.51 and is no longer necessary.
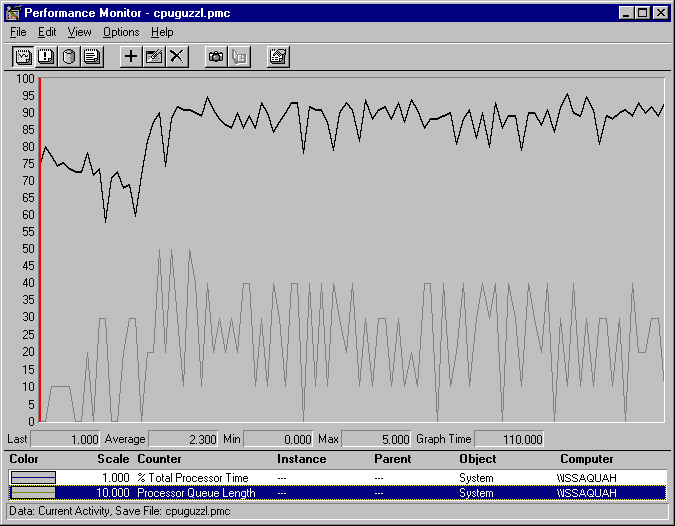
The clearest symptom of a processor bottleneck is a sustained or recurring queue of more than 2 threads. Although queues are most likely to develop when the processor is very busy, they can develop when utilization is well below 90%, and as low as 60–70%. The following graph shows a sustained processor queue with utilization ranging from 50–90%:

In this graph, the black line at the top represents System: %Total Processor Time. The gray line is System: Processor Queue Length. Queues are more likely to develop at lower processor use rates when the requests for processor time arrive in clusters or are random.
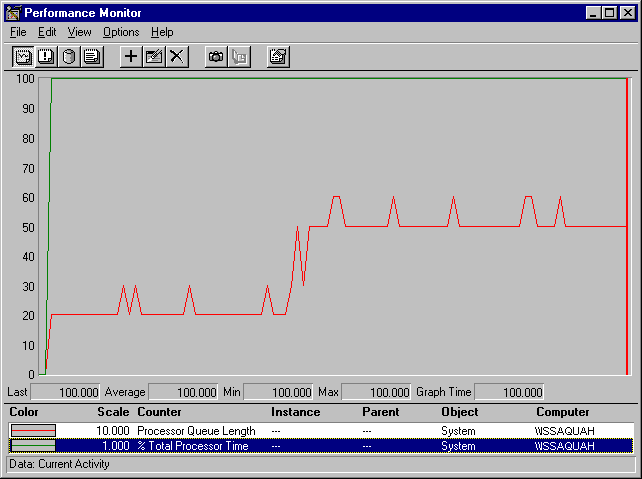
The following graph shows a sustained processor queue accompanied by processor use at or near 100%.

In this example, the queue length averages about 4 with a maximum of 7, and it never falls below 2. Note that the Processor Queue Length counter scale is multiplied by 10 to make the values easier to see. (The same effect could be achieved by reducing the vertical maximum to 10.)
If your system charts look like this, log over a longer period of time. This use pattern might be limited to a certain time of day. If so, you might be able to eliminate this bottleneck by changing the load balance between computers. However, if sustained queues appears frequently, more investigation is warranted.
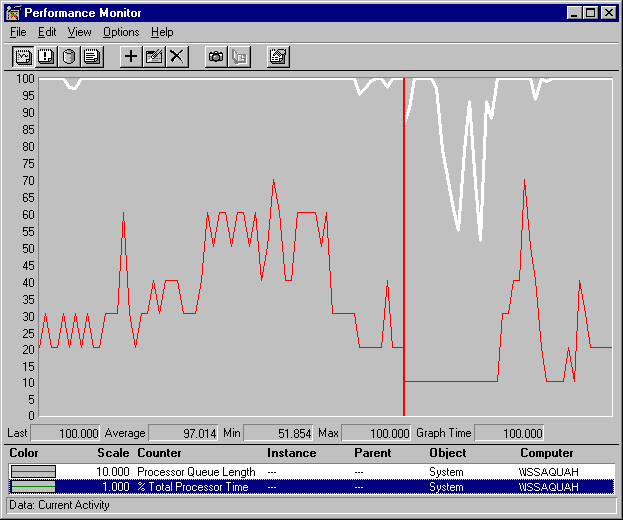
The following figure uses the queue length counter to confirm a bottleneck. It shows that when a processor is already at 100% utilization, starting another process doesn't accomplish more work.

In this example, the dark line running across the top of the graph is System: % Total Processor Time. The gray line below it is System: Processor Queue Length. Midway through the sample interval, a process with three threads was started. The graph illustrates that the queue increased by three threads. Some of the threads of the added process might be in the queue, or they might be running, having displaced the threads of a lower priority process. Nonetheless, because the processor was already at maximum capacity, no more work is accomplished.