A long processor queue is a warning that a bottleneck, however brief, might be developing. The Thread: Thread State counter lets you examine which threads are in the queue and how long they remain before being serviced.
By definition, all of the threads in the processor queue are Ready, but are waiting for a processor to become available. Ready is a dispatcher thread state, one of eight states that signal when a thread is prepared to be dispatched to the processor.
The following table lists the thread states for threads in Windows NT.
Thread state | Definition |
0 | Initialized. The thread is recognized as an object by the microkernel. |
1 | Ready. The thread is prepared to run on the next free processor. |
2 | Running. The thread is executing. |
3 | Standby. The thread is assigned to a processor and about to run. Only one thread can be in Standby state at a time. |
4 | Terminated. The thread is finished executing. |
5 | Waiting. The thread is not ready for the processor. When it is ready, it will have to be rescheduled. |
6 | Transition. The thread is ready but waiting for resources other than the processor to become available. |
7 | The thread state is unknown. |
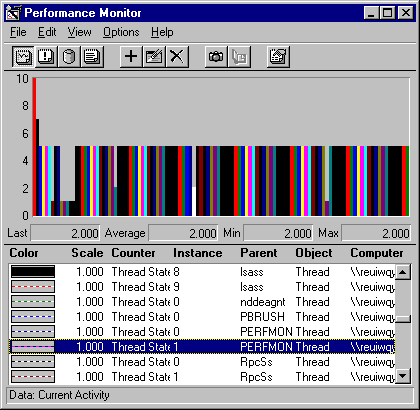
To determine which threads are contending for the processor, chart the thread states of all threads in the system. The following figure shows such a chart. The vertical maximum is reduced to 10 to show the values which range from 0 through 7.
The first, tallest bar is System: % Total Processor Time, is 100%, scaled to 0.1 to fit in the chart. The next bar is System: Processor Queue Length, which is 7. The remaining bars represent the thread states of threads in active processes.
The thread that is running on the processor, that is, at Thread State 2, is PERFMON Thread 1, a thread of the Performance Monitor executable. (It is represented by the white bar in middle of the graph.) In fact, a Performance Monitor thread always appears as the running thread when it captures data; if it weren't, it could not be capturing the data. This is an inescapable artifact of the tool.
Therefore, in Thread State charts or graphs, you need to assume that the processes getting processor time are those bouncing from Ready and in the queue (1) to Waiting (5). In this example, the bars at Ready (1) are the first few on the left, representing the processor-guzzling simulation tool, a System thread, two Services threads, and an RPC subsystem thread. (As you scroll through a running Performance Monitor graph, the thread state value appears in the value bar.)
The pattern of thread state activity is better seen in a line graph. Although it is much busier, it reveals the patterns of processor use by each thread.
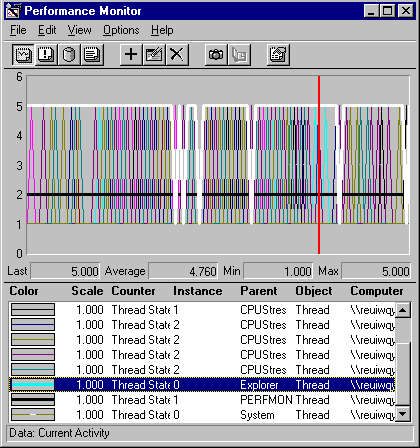
To create a graph like this one, chart all running threads, then delete threads that are never ready and set the vertical maximum to 6. This is a bit hard to read in still life, but the patterns for each thread become more apparent when you highlight the selected line by pressing the backspace key.
The black line that always appears to be running (at thread state 2) is PERFMON. The lines with the most activity are those of CPU Stress, the simulation tool. The white line is a thread of the Explorer process.
Although busy, this graph highlights which threads are in the queue and reveals their scheduling patterns. On logged data, you can use the Time Window to limit a thread state graph to selected data points, so you can measure the elapsed time a thread spent in each thread state. Summing the time in the ready state in each second sampled will tell you how long, on average, the threads are waiting in the queue. This information is quite useful when tuning thread behavior.