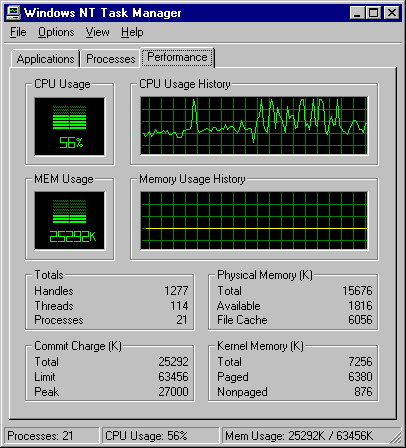
Click the Task Manager Performance Tab to see an dynamic overview of system performance, including a graph and numeric display of processor and memory usage.

To graph the percentage of processor time in privileged or kernel mode, click Show Kernel Times on the View menu. This is a measure of the time applications are using operating system services. The remaining time, known as user mode, is spent running threads within the application code.
Users of multiple processor computers can click CPU History from the View menu and choose to graph the non-idle time of each processor in a single graph or in separate graphs.
The following table briefly describes the counts on the Performance tab and their Performance Monitor counterparts, if any.
Table 11.1 Relating Task Manager Counts to Performance Monitor Counters
Task Manager Counts | Description | Performance Monitor counters | |||||||
CPU Usage | The percentage of time the processor is running a thread other than the Idle thread. | Processor: % Processor Time and System: % Total Processor Time | |||||||
MEM Usage | The amount of virtual memory used, in kilobytes. | Memory: Committed bytes | |||||||
Total Handles | The number of object handles in the tables of all processes. | Process: Handle Count: _Total | |||||||
Total Threads | The number of running threads, including one Idle thread per processor. | Process: Thread Count: _Total | |||||||
Total Processes | The number of active processes, including the Idle process. | Object: Processes is the same, but excludes the Idle process | |||||||
Physical Memory: Total | Amount of physical, random access memory installed in the computer, in kilobytes. | None | |||||||
Physical Memory: Available | Amount of physical memory available to processes, in kilobytes. It includes zeroed, free, and standby memory. | Memory: Available Bytes | |||||||
Physical Memory: File Cache | Amount of physical memory released to the file cache on demand, in kilobytes. | Memory: Cache Bytes | |||||||
Commit Charge: Total | Size of virtual memory in use by all processes, in kilobytes. | Memory: Committed Bytes | |||||||
Commit Charge: Limit | Amount of virtual memory, in kilobytes, that can be committed to all processes without enlarging the paging file. | Memory: Commit Limit | |||||||
Commit Charge: Peak | The maximum amount of virtual memory used in the session, in kilobytes. The commit peak can exceed the commit limit if virtual memory is expanded. | None | |||||||
Kernel Memory: Total | Sum of paged and non-paged kernel memory, in kilobytes. Kernel refers to memory available to operating system components running in highly privileged kernel mode. | None (Sum of Pool Paged Bytes and Pool Nonpaged Bytes) | |||||||
Kernel Memory: Paged | Size of the paged pool allocated to the operating system, in kilobytes. The paged pool is an area of operating system memory that can be paged to disk as applications demand more memory. | Memory: Pool Paged Bytes | |||||||
Kernel Memory: Nonpaged | Size of the nonpaged pool allocated to the operating system, in kilobytes. The nonpaged pool is the part of operating system memory that remains in physical memory as long as it is allocated. | Memory: Pool Nonpaged Bytes | |||||||