Macro Sheets Only
Adds error bars to the selected series in a chart. ERRORBAR.X adds bars showing the error factor for the X (category) axis and works for XY (scatter) charts only. ERRORBAR.Y adds bars showing the error factor for the Y (value) axis for all charts.
Syntax
ERRORBAR.X(include, type, amount, minus)
ERRORBAR.Y(include, type, amount, minus)
Include specifies the type of error value to include:
Include Type of error value
1 or omitted Plus and minus
2 Plus
3 Minus
4 None
Type specifies the type of error bars to display:
Type Type of error displayed
1 or omitted Fixed amount
2 Percent
3 Multiplying factor standard deviation (default value is 1)
4 Standard error
5 Custom
Amount is the range of error values to display. This argument depends on the value of type:
If type is then amount
1 or omitted can be any number greater than 0
2 can be any number greater than 0
3 can be any number greater than or 0
4 not required
5 is the positive amount for custom error bars
Minus is the negative amount for custom error bars. Applicable only if type is 5.
Remarks
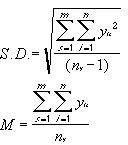
For the amount argument, standard deviation(s) can be calculated using this equation:

The standard deviation is multiplied by the value specified by amount and the error bars are placed this distance from the arithmetic mean. Therefore, these error bars are plotted along the arithmetic mean, not attached to data series.
Microsoft Excel calculates the standard error using the following equation:

Both the standard deviation and standard error functions use the following variables:
Variable Equals
s series number
i point number in series s
m number of series for point y in chart
n number of points in each series
Yi data value of series s and the ith point
Ny total number of data values in all series
M arithmetic mean
Related Functions
List of Command-Equivalent Functions