Sometimes you can find the cause of a problem by executing portions of code. More often, however, you have to analyze what's happening to the data as well. For example, you might isolate a problem in a variable or property with an incorrect value. Then you must determine how and why that variable or property was assigned an incorrect value.
In the Debug window, you can monitor the values of expressions and variables while stepping through the statements in your code. You can also use the Debug window to change the value of variables and properties in break mode to see how different values affect your code.
You display the Debug window by doing one of the following:
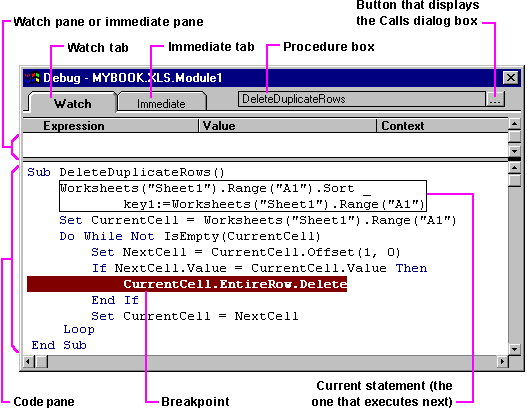
The Debug window has two halves: The upper half is either the Watch pane or the Immediate pane; the lower half is the Code pane. In the Code pane, the current execution point in the code has a rectangular outline around it. You can scroll through the Code pane to look at other parts of the code.

The Watch pane displays the current watch expressions expressions whose values you decide to monitor as the code runs. The Immediate pane displays information that results from debugging statements in your code or information you request by typing commands directly in the pane. The first time you display the Debug window, the Immediate pane is on top; thereafter, the last pane you chose is on top.
In the Watch pane, the Context column indicates the procedure, module, and workbook in which each watch expression is evaluated. The Watch pane can display a value for a watch expression only if the current statement is in the specified context; otherwise, the Value column displays a message indicating that the statement is out of context. For example, if you set a watch expression on a statement in a procedure, the statement is out of context until you run the procedure. For more information about using watch expressions, see "Monitoring Data with Watch Expressions" later in this chapter.