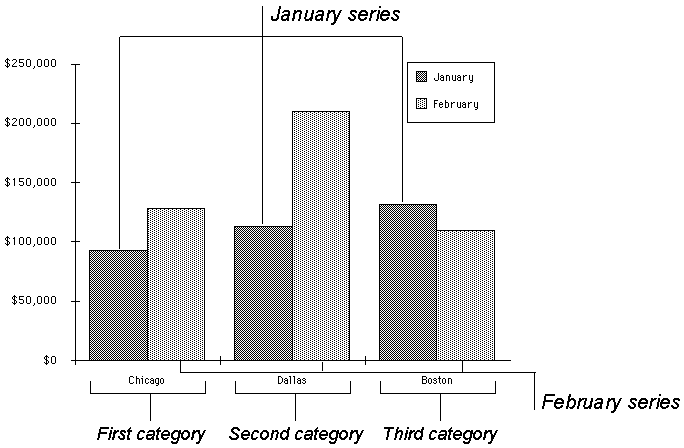
All charts, whether in column, bar, line, pie, area, or scatter format, contain series data, category data, and value data. The following column chart explains the difference between series and categories.

When Microsoft Excel creates a chart from a worksheet, it assigns either the worksheet rows as the series data (and the columns as the category data), or the worksheet columns as the series data (and the rows as categories). If there are fewer rows than columns, then the rows become the series. However, if there are fewer columns than rows, then the columns become the series. If there are an equal number of rows and columns in the range of cells, then the rows become the series.
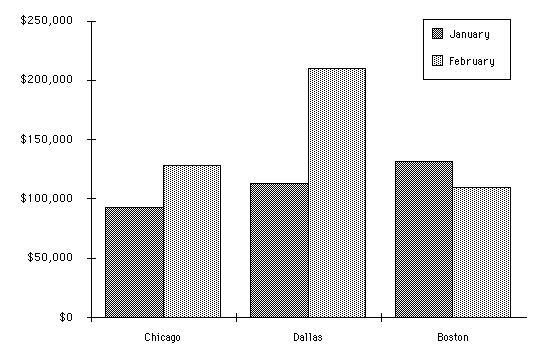
This algorithm minimizes the number of series on the chart. For example, the following column chart . . .

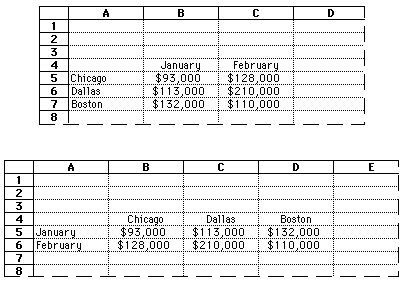
. . . can be created from either of the two following worksheets.

In the second worksheet shown here, January and February are the series (because there are fewer rows than columns), and Chicago, Dallas, and Boston are the categories. In these two worksheets, values for each series appear at three locations on the chart.
If you add sales data for March and April, the series are now Chicago, Dallas, and Boston, and the categories are January, February, March, and April. Microsoft Excel automatically exchanges the series and categories to minimize the number of series.
Chart BIFF Records: Alphabetical Order
|
Number |
Record | |
|
103A |
3D: Chart Group Is a 3-D Chart Group | |
|
1051 |
AI: Linked Data | |
|
1050 |
ALRUNS: Text Formatting | |
|
101A |
AREA: Chart Group Is an Area Chart Group | |
|
100A |
AREAFORMAT: Colors and Patterns for an Area | |
|
100C |
ATTACHEDLABEL: Series Data/Value Labels | |
|
1062 |
AXCEXT: Axis Options | |
|
1046 |
AXESUSED: Number of Axes Sets | |
|
101D |
AXIS: Axis Type | |
|
1021 |
AXISLINEFORMAT: Defines a Line That Spans an Axis | |
|
1041 |
AXISPARENT: Axis Size and Location | |
|
1017 |
BAR: Chart Group Is a Bar or Column Chart Group | |
|
1033 |
BEGIN: Defines the Beginning of an Object | |
|
1061 |
BOPPOP: Bar of Pie/Pie of Pie Chart Options | |
|
1067 |
BOPPOPCUSTOM: Custom Bar of Pie/Pie of Pie Chart Options | |
|
1020 |
CATSERRANGE: Defines a Category or Series Axis | |
|
1002 |
CHART: Location and Overall Chart Dimensions | |
|
1014 |
CHARTFORMAT: Parent Record for Chart Group | |
|
1022 |
CHARTFORMATLINK: Not Used | |
|
101C |
CHARTLINE: Drop/Hi-Lo/Series Lines on a Line Chart | |
|
1063 |
DAT: Data Table Options | |
|
1006 |
DATAFORMAT: Series and Data Point Numbers | |
|
1024 |
DEFAULTTEXT: Default Data Label Text Properties | |
|
103D |
DROPBAR: Defines Drop Bars | |
|
1034 |
END: Defines the End of an Object | |
|
1060 |
FBI: Font Basis | |
|
1026 |
FONTX: Font Index | |
|
1032 |
FRAME: Defines Border Shape Around Displayed Text | |
|
1066 |
GELFRAME: Fill Data | |
|
104E |
IFMT: Number-Format Index | |
|
1015 |
LEGEND: Legend Type and Position | |
|
1043 |
LEGENDXN: Legend Exception | |
|
1018 |
LINE: Chart Group Is a Line Chart Group | |
|
Number |
Record | |
|
1007 |
LINEFORMAT: Style of a Line or Border | |
|
1009 |
MARKERFORMAT: Style of a Line Marker | |
|
1027 |
OBJECTLINK: Attaches Text to Chart or to Chart Item | |
|
103C |
PICF: Picture Format | |
|
1019 |
PIE: Chart Group Is a Pie Chart Group | |
|
100B |
PIEFORMAT: Position of the Pie Slice | |
|
1035 |
PLOTAREA: Frame Belongs to Plot Area | |
|
1064 |
PLOTGROWTH: Font Scale Factors | |
|
104F |
POS: Position Information | |
|
103E |
RADAR: Chart Group Is a Radar Chart Group | |
|
1040 |
RADARAREA: Chart Group Is a Radar Area Chart Group | |
|
1048 |
SBASEREF: PivotTable Reference | |
|
101B |
SCATTER: Chart Group Is a Scatter Chart Group | |
|
105B |
SERAUXERRBAR: Series ErrorBar | |
|
104B |
SERAUXTREND: Series Trendline | |
|
105D |
SERFMT: Series Format | |
|
1003 |
SERIES: Series Definition | |
|
1016 |
SERIESLIST: Specifies the Series in an Overlay Chart | |
|
100D |
SERIESTEXT: Legend/Category/Value Text | |
|
104A |
SERPARENT: Trendline or ErrorBar Series Index | |
|
1045 |
SERTOCRT: Series Chart-Group Index | |
|
1044 |
SHTPROPS: Sheet Properties | |
|
1065 |
SIINDEX: Series Index | |
|
103F |
SURFACE: Chart Group Is a Surface Chart Group | |
|
1025 |
TEXT: Defines Display of Text Fields | |
|
101E |
TICK: Tick Marks and Labels Format | |
|
1001 |
UNITS: Chart Units | |
|
101F |
VALUERANGE: Defines Value Axis Scale | |
Chart BIFF Records: Record Number Order
|
Number |
Record | |
|
1001 |
UNITS: Chart Units | |
|
1002 |
CHART: Location and Overall Chart Dimensions | |
|
1003 |
SERIES: Series Definition | |
|
1006 |
DATAFORMAT: Series and Data Point Numbers | |
|
Number |
Record | |
|
1007 |
LINEFORMAT: Style of a Line or Border | |
|
1009 |
MARKERFORMAT: Style of a Line Marker | |
|
100A |
AREAFORMAT: Colors and Patterns for an Area | |
|
100B |
PIEFORMAT: Position of the Pie Slice | |
|
100C |
ATTACHEDLABEL: Series Data/Value Labels | |
|
100D |
SERIESTEXT: Legend/Category/Value Text | |
|
1014 |
CHARTFORMAT: Parent Record for Chart Group | |
|
1015 |
LEGEND: Legend Type and Position | |
|
1016 |
SERIESLIST: Specifies the Series in an Overlay Chart | |
|
1017 |
BAR: Chart Group Is a Bar or Column Chart Group | |
|
1018 |
LINE: Chart Group Is a Line Chart Group | |
|
1019 |
PIE: Chart Group Is a Pie Chart Group | |
|
101A |
AREA: Chart Group Is an Area Chart Group | |
|
101B |
SCATTER: Chart Group Is a Scatter Chart Group | |
|
101C |
CHARTLINE: Drop/Hi-Lo/Series Lines on a Line Chart | |
|
101D |
AXIS: Axis Type | |
|
101E |
TICK: Tick Marks and Labels Format | |
|
101F |
VALUERANGE: Defines Value Axis Scale | |
|
1020 |
CATSERRANGE: Defines a Category or Series Axis | |
|
1021 |
AXISLINEFORMAT: Defines a Line That Spans an Axis | |
|
1022 |
CHARTFORMATLINK: Not Used | |
|
1024 |
DEFAULTTEXT: Default Data Label Text Properties | |
|
1025 |
TEXT: Defines Display of Text Fields | |
|
1026 |
FONTX: Font Index | |
|
1027 |
OBJECTLINK: Attaches Text to Chart or to Chart Item | |
|
1032 |
FRAME: Defines Border Shape Around Displayed Text | |
|
1033 |
BEGIN: Defines the Beginning of an Object | |
|
1034 |
END: Defines the End of an Object | |
|
1035 |
PLOTAREA: Frame Belongs to Plot Area | |
|
103A |
3D: Chart Group Is a 3-D Chart Group | |
|
103C |
PICF: Picture Format | |
|
103D |
DROPBAR: Defines Drop Bars | |
|
103E |
RADAR: Chart Group Is a Radar Chart Group | |
|
103F |
SURFACE: Chart Group Is a Surface Chart Group | |
|
Number |
Record | |
|
1040 |
RADARAREA: Chart Group Is a Radar Area Chart Group | |
|
1041 |
AXISPARENT: Axis Size and Location | |
|
1043 |
LEGENDXN: Legend Exception | |
|
1044 |
SHTPROPS: Sheet Properties | |
|
1045 |
SERTOCRT: Series Chart-Group Index | |
|
1046 |
AXESUSED: Number of Axes Sets | |
|
1048 |
SBASEREF: PivotTable Reference | |
|
104A |
SERPARENT: Trendline or ErrorBar Series Index | |
|
104B |
SERAUXTREND: Series Trendline | |
|
104E |
IFMT: Number-Format Index | |
|
104F |
POS: Position Information | |
|
1050 |
ALRUNS: Text Formatting | |
|
1051 |
AI: Linked Data | |
|
105B |
SERAUXERRBAR: Series ErrorBar | |
|
105D |
SERFMT: Series Format | |
|
1060 |
FBI: Font Basis | |
|
1061 |
BOPPOP: Bar of Pie/Pie of Pie Chart Options | |
|
1062 |
AXCEXT: Axis Options | |
|
1063 |
DAT: Data Table Options | |
|
1064 |
PLOTGROWTH: Font Scale Factors | |
|
1065 |
SIINDEX: Series Index | |
|
1066 |
GELFRAME: Fill Data | |
|
1067 |
BOPPOPCUSTOM: Custom Bar of Pie/Pie of Pie Chart Options | |