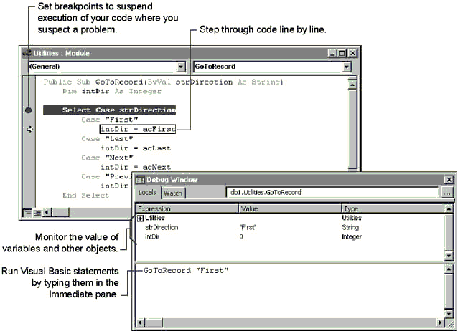
When you’re debugging your code, your task is to determine where something went wrong. Perhaps you chose the wrong operator, used the wrong function somewhere, or forgot to initialize a variable. While there are no magic tricks to debugging, Microsoft Access provides debugging tools to help you analyze errors in your Visual Basic code. These tools are particularly helpful in analyzing program logic errors.
You can often uncover a problem with code more quickly if you can analyze what’s happening to the data while portions of your code are running. One way you can do this is by using the Debug window to monitor the current values of expressions and variables as you step through a procedure. If you can isolate the problem to a variable or property that contains an incorrect value, then you know you must determine how or why the value was incorrectly assigned. You can also use the Debug window to change the value of variables and properties while your code is suspended to see how different values affect your code.
To display the Debug window, press CTRL+G or click Debug Window on the View menu. The Debug Window menu command is available only when the Module window is active.
The following illustration points out some of the techniques you can apply by using the debugging tools provided in Microsoft Access.

The following sections discuss specific ways to use the debugging tools.