Many problems encountered while debugging can’t be traced to a single statement. You may need to monitor the behavior of a variable or expression while a procedure is running. Perhaps a problem occurs only when a variable or property contains a certain value or range of values. You may also find that a calculation isn’t producing the result you want.
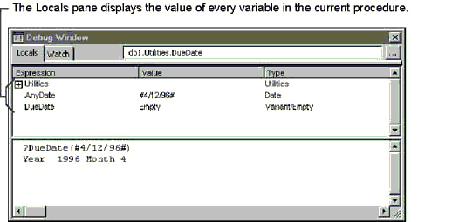
When execution is suspended, you can use the top half of the Debug window—either the Locals pane or the Watch pane—to examine the values of expressions and variables in the suspended code. The Locals pane automatically displays all the variables and objects in the current procedure, providing the easiest way to view local variable and property values. In the Watch pane, you can track variables across your entire application.
For example, if you place a breakpoint in the DueDate function and then call the function, the breakpoint suspends execution. You can then examine the value of the function’s AnyDate argument in the Locals pane, as shown in the following illustration.

Because the status box of the Debug window indicates the current module and the current procedure, if there is one, you always know which module and which procedure are current even if you switch between different Module windows.
The Debug window can display objects, such as forms or controls. When an event procedure is running, for example, details about the form or report it belongs to are available in the Locals pane of the Debug window. Additionally, if the current procedure contains object variables, their values appear in the Locals pane.
The Debug window displays objects with a plus-sign symbol to the left of each object name. To expand an object—display all its members—click the plus sign. For example, clicking the plus sign next to a Form object displays the controls and properties of the form along with their current values. If any these members in turn are objects, such as controls on the form, they too have plus signs to indicate this.
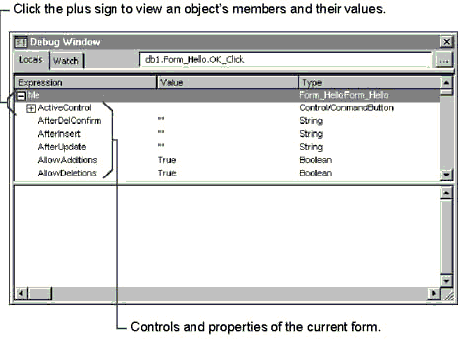
To collapse an object—hide all its members—click the minus sign to the left of the object name. By expanding and collapsing objects in the Debug window, you can explore as much or as little detail as you want.
You can monitor the value of a particular variable or expression by using a watch expression. A watch expression is a user-defined expression that you use to observe the behavior of a variable or expression in your code. While the Locals pane of the Debug window is the most convenient place to view values of variables and properties, watch expressions give you added flexibility. For example, you can enter any expressions you like—not only variables—and you can follow variables that aren’t local to the current procedure while you run through various procedures in your application.
When the Debug window is active, the watch expressions that you have established appear in the Watch pane, where you can observe their values. Whenever code is running and a watch expression is in context (currently has a value), the Watch pane displays the value of the watch expression.
You can also specify that execution of your code be suspended whenever a watch expression’s value changes or equals a specified value. For example, instead of using the Step Into command to progress through many iterations of a loop, you can use a watch expression to suspend the code when the loop counter reaches a certain number. You can also choose to suspend the execution of your code every time a specific variable changes value.
You can add a watch expression before running a procedure, or after execution has been suspended. To add a watch expression, click Add Watch on the Debug menu. The following figure illustrates how to use the Add Watch dialog box.
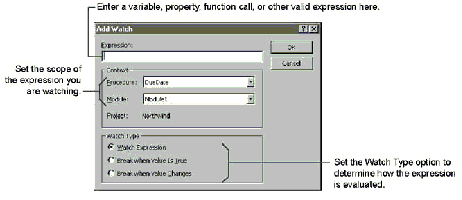
You can also restrict the scope used to watch variables to a specific procedure, a specific module, or globally in the code. Visual Basic can evaluate a variable more quickly in a narrow context.
You can edit or delete any watch expression you select in the Watch pane of the Debug window by clicking Edit Watch on the Debug menu. The Edit Watch dialog box looks just like the Add Watch dialog box, shown in the previous figure, with a Delete button added.
To the left of each watch expression in the Watch pane of the Debug window is an icon that identifies the watch type. The icons for each of the three watch types are shown in the following figure.


While the execution of your code is suspended, you can use the Quick Watch command (Debug menu) to check the value of an expression that hasn’t been defined as a watch expression. You can also click the Quick Watch button on the toolbar to create a watch expression from text you’ve selected in the Module window. This brings up the box that appears in the following illustration.

If Visual Basic cannot evaluate the expression that you have chosen, the Add button is not available.
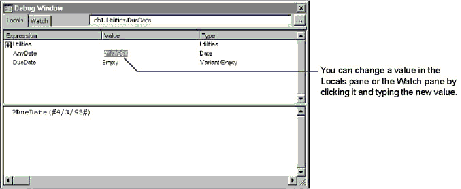
In addition to examining the values of variables and expressions, you can also use the Locals pane or the Watch pane to assign new values to controls, properties, and variables. This is useful when you are debugging; as you develop hypotheses about the cause of an error, you may want to test the effects of particular values.
To change the value of a variable or property, locate the value in the Locals pane or the Watch pane, click the value in the Value column for the item you want to change, type the new value, and then press ENTER.
You can also use the Immediate pane to set values. For example, you can type assignment statements such as:
Forms!SalesReps!Title = "Sales Executive"
Forms!SalesReps!Title.Visible = False
intRows = 50
After you change the values of one or more controls, properties, or variables, you can continue execution to see the results of your changes.