Steve Kirk
MSDN Content Development Group
December 1997
Updated: February 2, 1998
Click to copy the sample files for this technical article.
In this project, I'll use Dynamic HTML (DHTML) and the DirectAnimation Structured Graphics Control (included with Microsoft® Internet Explorer 4.0) in a statistical monitoring application for the HelpDesk system. The monitoring application presents the system administrator with a graphical model of system activity along a continuous time line. The DHTML display can be navigated by zooming and panning and provides the ability to drill into the graphical representation to retrieve detail data. The Structured Graphics Control allows you to create windowless vector graphics where overlapping lines and shapes are treated as individual programmable entities.
I'll start by developing a method for gathering and storing periodic snapshots of system status with consideration of data depth, polling frequency, and scalability. I'll then develop the DHTML client application and include an exploration of DirectAnimation vector graphics and an architecture of HTML components (scriptlets). In both the client and the server, I'll use COM components written in Microsoft Visual Basic® for lower-level data services.
The HelpDesk sample application includes a set of client applications, multitiered COM services, and a SQL Server database. The HelpDesk Monitor client requires Internet Explorer 4.0 and the server requires Microsoft SQL Server 6.5 and the HelpDesk database. The HelpDesk API components are also required.
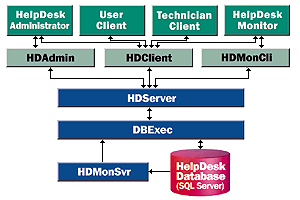
Figure 1 shows the HelpDesk object model, including the monitoring components. A recurring scheduled task in SQL Server controls a COM component that takes a snapshot of system data, packages the data into a single entity, and then inserts the entity into the database. Because the packaging operation can be more easily written in Visual Basic than in Transact-SQL, I placed the packaging code in an external COM component (HDMonSvr) that calls back into the SQL Server database through the DBExec layer of the HelpDesk COM API.
On the client, the DHTML graphics components provide timeline graphics and detail reports from data provided through a specialized COM component (HDMonCli) and the HelpDesk client component (HDClient). Code in HDMonCli retrieves, caches, and unpackages snapshot data to service the graphics components.

Figure 1. Overview of the monitoring system
Determining the right amount of performance data to capture and save necessitates an analysis of the tradeoffs between depth, frequency, and storage. Highly detailed snapshots taken at a high frequency and stored forever will allow a lot of historical playback, trend analysis, and detail drilling, but they will also consume massive resources. If only a few data fields are captured from a request queue containing only a hundred records at a lazy rate of once a minute, there will soon be a great amount of data stored. Therefore, this system is designed around the following guidelines:
By using a single data entity with a variable length field for each snapshot, the data can be stored compactly and it can be retrieved with relatively inexpensive (joinless) queries. By describing the request queue hierarchically, with summary information easily accessible at the beginning of the structure and detail data available by parsing the data more completely, a top-level overview is readily available and details can be retrieved with more work on demand. The structure also allows data to be thinned as it becomes less current by simply lopping off detail and leaving totals and subtotals. Table 1 shows the Snapshot data entity.
Table 1. Snapshot Data Entity
| Field | Description |
| PKId | Primary key identifier |
| Date | Date/time of snapshot |
| SnapData | Data describing system state |
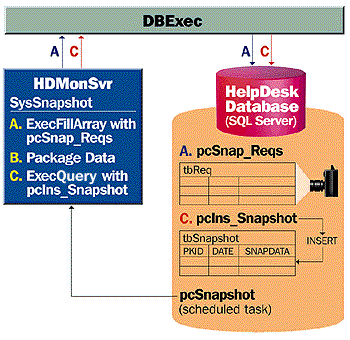
Figure 2 shows the snapshot procedure that is executed at regular intervals under the control of a recurring scheduled task. The task executes pcSnapshot, which calls out to the HDMonSvr COM component to query the request table (tbReq) and to package the resultant data for insertion into the Snapshot table (tbSnapshot) as a snapshot entity. Data thinning follows a parallel process with additional scheduled tasks in SQL Server and a few thinning procedures in the COM component.

Figure 2 Gathering and storing snapshot data
The following Transact-SQL code from pcSnapshot shows how the COM object is instantiated and how the SysSnapshot method of the HDMonSvr.CSnapshot object is called:
CREATE PROCEDURE pcSnapshot AS
. . .
--Instantiate HDMonSvr CSnapshot object
EXEC @hr = sp_OACreate 'HDMonSvr.CSnapshot', @Monitor OUT
. . .
--Call SysSnapshot method
EXEC @hr = sp_OAMethod @Monitor, 'SysSnapshot'
. . .
--Destroy the object
EXEC @hr = sp_OADestroy @Monitor
. . .
GO
The following Visual Basic code within HDMonSvr retrieves an array of all current requests and packages this data into a single string for use in the SnapData field of the Snapshot entity. The procedure then inserts the packaged snapshot data into the Snapshot table by executing pcIns_Snapshot:
Public Function SysSnapShot()
. . .
sQry = scExecute & scSysSnapshot
' New instance of CExec class under MTS.
Set oExec = New DBExec.CExec
' Fill array with status data from database.
If oExec.ExecFillArray(scConnect, sQry, sData) Then
' Package data in snapdata format.
    If PackSnapData(sData, sSnap) Then
        sQry = scExecute & scInsertSnapshot
        sQry = sQry & " @SnapData = " & sSnap
        'Insert snapshot entity into database.
        If oExec.ExecQuery(scConnect, sQry) Then
            SysSnapShot = True
        End If
    End If
End If
' Release oExec.
Set oExec = Nothing
End Function
The monitor application page, monitor.htm, contains data services objects and a timeline object that exposes the programming model described in Table 2. The timeline object is a scriptlet, which differs from the COM objects in that it is written in HTML.
Table 2. Timeline Programming Model
| Property | Description |
| Period | Period of time represented by the horizontal width of the display in a date/time numerical format. |
| Start | Date/time at the display origin (left side of display) |
| MaxValue | Quantity for maximum value scale |
| MinValue | Quantity for minimum value scale |
| DetailLevel | Controls what subtotal traces are drawn |
| TimeDiv | Number of divisions along the time axis |
| ValueDiv | Number of divisions along the value axis |
| Method | Description |
| PageFirst | Displays the first page of the system history |
| PageBack | Displays the previous page of the system history |
| PageForward | Displays the next page of the system history |
| PageLast | Displays the last page of the system history |
| Refresh | Refreshes the display |
The following code, from monitor.htm, shows how the Timeline object is created from the scriptlet code in timeline.htm:
<object id=oTimeLine TYPE="text/x-scriptlet"
   style="height:85%;width:100%">
   <param name="url" value="timeline.htm"
</object>
When monitor.htm loads, the Window_OnLoad() script initializes the timeline to display request totals for the current day:
Sub Window_OnLoad()
. . .
' Display activity since midnight.
dT = Now()
DispStart = DatePart("m", dT) & DateDiv & _
    DatePart("d", dT) & DateDiv & DatePart("yyyy", dT)
' Set oTimeline properties and refresh display.
oTimeline.Start = DispStart
oTimeline.Period = Day
oTimeline.Refresh
End SubThe navigation controls provide means to zoom and pan through time. The pan controls call the PageFirst, PageBack, PageForward, and PageLast methods, which work by manipulating the Start property, while the zoom control allows you to navigate by manipulating both the start date and period. All the navigation methods eventually call the Refresh method. The following Microsoft Visual Basic Scripting Edition (VBScript) code, from the Timeline scriptlet, shows that Refresh starts by preparing the data supply. It then draws the timeline background and finishes with the data traces:
Sub Public_Refresh()
ODataSource.CompletePeriodData (m_Start, m_Period)
DrawBackground()
DrawTraces()
End Sub
The client-side monitor component (HDMonCli) provides services that retrieve and cache snapshot data in order to service the monitor interface. The CompletePeriodData method prepares the HDMonCli.CMonData object data cache for the specified starting date/time and duration. As the following code segment shows, the procedure determines what data is not yet cached for the display period and retrieves that data:
Public Function CompletePeriodData(ByVal vStart, ByVal vDuration)
. . .
' Resolve the display boundary dates.
If CBoundDates(vStart, vDuration, dFirst, dLast) Then
' Build the list of snapshots required for display.
    If FillSnapList(dFirst, dLast) Then
' Retrieve any uncached snapshots.
        If FillSnapCache(dFirst, dLast) Then
            CompletePeriodData = True
        End If
    End If
End If
End FunctionTimeline graphics consist of a background, which displays the axis divisions and labels, and at least one layer of data plotted over this background. The number of layers of data that are displayed is governed by the DetailLevel property of oTimeline, which provides one of the mechanisms for drilling into detailed data. I am building each of these graphics layers as a separate instance of the Structured Graphics Control so that each graphic layer will have distinct interactive behavior. The Structured Graphics Control provides hit detection by responding to mouse events over opaque areas only. Mouse events over transparent areas pass through to lower layers. (For more information about DirectAnimation and the Structured Graphics Control, see the "Multimedia" section of the Internet Client SDK.)
Objects representing the graphic layers are maintained in the Traces collection on oHDMonCli. The next VBScript procedure, called from the oTimeline Refresh method, updates each of them:
Sub DrawTraces()
. . .
' Process each trace object.
For each otr in m_oHDMonCli.Traces
' Get the point list for the trace.
    SetPoints dat, otr.Level
' Plot the data points.
    PlotPline otr, dat
Next
. . .
End Sub
The following VBScript code plots the points on the Structured Graphics Object:
Sub PlotPline(oTrace, plst)
. . .
' Get the drawing surface interface from Structured Graphics Objecset ds = oTrace.SGObject.DrawSurface
' Clear the drawing surface and set the drawing attributes.
ds.clearor
ds.LineColor oTrace.ColorBehavior
ds.LineWidth oTrace.LineWidth
' Draw the point list as a polyline.
ds.polyline(plst)
' Display the drawing surface on the Structured Graphics Object.
oTrace.SGObject.DrawSurface = ds
. . .
End Sub
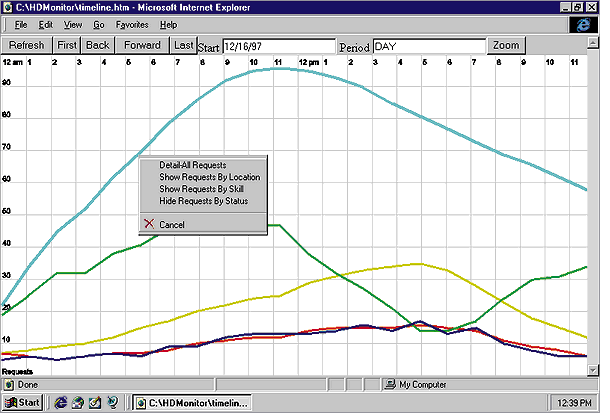
When the user moves the mouse over a trace, the trace is highlighted and the title of the trace is displayed as a tool tip. If the user right-clicks a data trace, an option menu is displayed. The option menu allows several steps of drill down, from expanding detail by attributes to displaying a complete detail report listing the appropriate requests. (The detail reports employ data-bound tables. For more information on DHTML data binding see "DHTML, Data Binding, and a HelpDesk Technician Client.")
Mouse events over Structured Graphics Controls are passed to the following procedure. By consolidating the interface for all mouse events at this point, I am able to localize the effect of event handling discontinuities between Structured Graphics Controls and the document (see the sample for details):
Sub TranslateSGEvent(ByVal SGId, ByVal EventType)
…
Select Case EventType
    Case MouseOver
' Highlight trace under mouse
        HighlightTraces SGId
    Case MouseOut
' Unhighlight trace
        HighlightTraces vbNullChar
    Case MouseDown_Right
' Display drill down menu
        DisplayDetailMenu SGId
…
End Select
End Sub
Although the traces can be highlighted as any other DHTML element by using a visual filter, DirectAnimation provides a more efficient highlighting method by specifying the line color of the trace as a ModifiableBehavior. One of the basic concepts in DirectAnimation is to specify attributes such as color and position as behaviors that vary over time. A ModifiableBehavior extends this concept so that the behavior can be specified at run time rather than at development time. The following procedure highlights the specified trace by modifying its color behavior:
Sub HighlightTraces (ByVal SGId)
…
For each otr in m-oHDMonCli.Traces
    Set lib = otr.SGObject.Library
    If otr.SGObject.Id = SGId Then
' Switch ColorBehavior to highlight color.
        otr.ColorBehavior.SwitchTo(lib.ColorRGB255(HLRed,HLGreen,HLBlue)
    Else
' Switch ColorBehavior to normal trace color.
        red = Otr.Red
        green = Otr.Green
        blue = Otr.Blue
        otr.ColorBehavior.SwitchTo(lib.ColorRGB255(red,green,blue)
    End If
Next
End Sub

Figure 3. Timeline display with status detail
The scriptlet objects presented here extend the object architecture of the HelpDesk system through to the windowless objects that represent the graph traces. The progression from general to specific is continuous from the fully reusable objects closest to the database in the business layer to the increasingly specific objects in the workflow and presentation layers. Those compiled components are joined here at the client by uncompiled scriptlet components. Scriptlets combine the organizing advantages that all components share with the small size, malleability, and superior multimedia capabilities of DHTML.