 To start the debugger
The Microsoft® Windows® CE Toolkit for Visual Basic® 5.0 debugger is designed specifically for Windows CE projects. Though it cannot diagnose or fix errors for you, it does help you analyze how execution flows from one part of a program to another, and how variables and property settings change as statements are executed. It lets you look inside your application to help you determine what happens and why.
The Windows CE debugger runs as a separate program outside of the Visual Basic IDE. It supports breakpoints, watch expressions, stepping through code one statement or one procedure at a time, and displaying the values of variables and properties.
 To start the debugger
– Or –
On the Main menu, choose Run, and then choose Start.
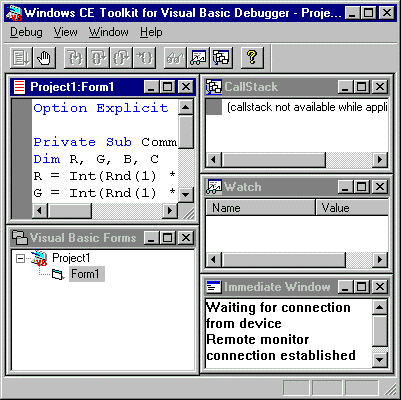
The debugger opens and following window appears:

 To exit the debugger