The debugging techniques presented in this chapter use the analysis tools provided by Visual Basic. Visual Basic cannot diagnose or fix errors for you, but it does provide tools to help you analyze how execution flows from one part of the procedure to another, and how variables and property settings change as statements are executed. Debugging tools let you look inside your application to help you determine what happens and why.
Visual Basic debugging support includes breakpoints, break expressions, watch expressions, stepping through code one statement or one procedure at a time, and displaying the values of variables and properties. Visual Basic also includes special debugging features, such as edit-and-continue capability, setting the next statement to execute, and procedure testing while the application is in break mode.
For More Information For a quick overview of Visual Basic debugging, see "Tips for Debugging" later in this chapter.
To understand how debugging is useful, consider the three kinds of errors you can encounter:
Compile errors result from incorrectly constructed code. If you incorrectly type a keyword, omit some necessary punctuation, or use a Next statement without a corresponding For statement at design time, Visual Basic detects these errors when you compile the application.
Compile errors include errors in syntax. For example, you could have a statement as follows:
Left
Left is a valid word in the Visual Basic language, but without an object, it doesn't meet the syntax requirements for that word (object.Left). If you have selected the Auto Syntax Check option in the Editor tab on the Options dialog box, Visual Basic will display an error message as soon as you enter a syntax error in the Code window.
To set the Auto Syntax Check option
For More Information See the section "Avoiding Bugs" later in this chapter for other techniques to use to avoid errors in your code.
Run-time errors occur while the application is running (and are detected by Visual Basic) when a statement attempts an operation that is impossible to carry out. An example of this is division by zero. Suppose you have this statement:
Speed = Miles / Hours
If the variable Hours contains zero, the division is an invalid operation, even though the statement itself is syntactically correct. The application must run before it can detect this error.
For More Information You can include code in your application to trap and handle run-time errors when they occur. For information on dealing with run-time errors, see "How to Handle Errors" earlier in this chapter.
Logic errors occur when an application doesn't perform the way it was intended. An application can have syntactically valid code, run without performing any invalid operations, and yet produce incorrect results. Only by testing the application and analyzing results can you verify that the application is performing correctly.
Debugging tools are designed to help you with:
For instance, an incorrect result may be produced at the end of a long series of calculations. In debugging, the task is to determine what and where something went wrong. Perhaps you forgot to initialize a variable, chose the wrong operator, or used an incorrect formula.
There are no magic tricks to debugging, and there is no fixed sequence of steps that works every time. Basically, debugging helps you understand what's going on while your application runs. Debugging tools give you a snapshot of the current state of your application, including:
The better you understand how your application is working, the faster you can find bugs.
For More Information For more details on viewing and testing variables, expressions, properties, and active procedure calls, see "Testing Data and Procedures with the Immediate Window" and "Monitoring the Call Stack" later in this chapter.
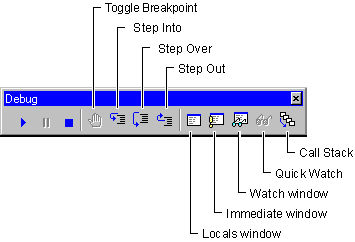
Among its many debugging tools, Visual Basic provides several buttons on the optional Debug toolbar that are very helpful. Figure 13.5 shows these tools. To display the Debug toolbar, right-click on the Visual Basic toolbar and select the Debug option.
Figure 13.5 The Debug toolbar

The following table briefly describes each tool's purpose. The topics in this chapter discuss situations where each of these tools can help you debug or analyze an application more efficiently.
| Debugging tool | Purpose |
| Breakpoint | Defines a line in the Code window where Visual Basic suspends execution of the application. |
| Step Into | Executes the next executable line of code in the application and steps into procedures. |
| Step Over | Executes the next executable line of code in the application without stepping into procedures. |
| Step Out | Executes the remainder of the current procedure and breaks at the next line in the calling procedure. |
| Locals Window | Displays the current value of local variables. |
| Immediate Window | Allows you to execute code or query values while the application is in break mode. |
| Watch window | Displays the values of selected expressions. |
| Quick Watch | Lists the current value of an expression while the application is in break mode. |
| Call Stack | While in break mode, presents a dialog box that shows all procedures that have been called but not yet run to completion. |
For More Information The debugging tools are only necessary if there are bugs in your application. See "Avoiding Bugs" later in this chapter.