Controlling an individual pixel is a simple graphics operation. The PSet method sets the color of a pixel at a specified point:
[object.]PSet (x, y)[, color]
The x and y arguments are single precision, so they can take either integer or fractional input. The input can be any numeric expression, including variables.
If you donít include the color argument, PSet sets a pixel to the foreground color (ForeColor). For example, the following statements set various points on the current form (the form to which the code is attached), MyForm, and picPicture1:
PSet (300, 100)
PSet (10.75, 50.33)
MyForm.PSet (230, 1000)
picPicture1.PSet (1.5, 3.2)
Adding a color argument gives you more control:
' Set 50, 75 to bright blue.
PSet (50, 75), RGB(0, 0, 255)
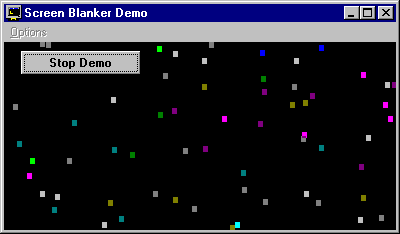
The Blanker application plots points with randomly selected colors to create the Confetti demo. The PSetDemo procedure creates the confetti:
Sub PSetDemo ()
   ' Set Red to random value.
   R = 255 * Rnd
   ' Set Green to random value.
   G = 255 * Rnd
   ' Set Blue to random value.
   B = 255 * Rnd
   ' Set horizontal position.
   XPos = Rnd * ScaleWidth
   ' Set vertical position.
   YPos = Rnd * ScaleHeight
   ' Plot point with random color.
   PSet (XPos, YPos), RGB(R, G, B)
End Sub
The resulting confetti display is shown in Figure 12.13.
Figure 12.13 Confetti display in the Blanker application

To "erase" a point, set it to the background color:
PSet (50, 75), BackColor
As described in "Drawing Lines and Shapes" later in this chapter, you can precede the (x, y) coordinates by Step, which makes the point relative to the last location drawn.
The Point method is closely related to the PSet method, but it returns the color value at a particular location:
PointColor = Point (500, 500)
For More Information For more information, see "PSet Method" and "Point Method" in the Language Reference.