The T-SQL debugger is integrated with the Data Environment designer. It allows you to interactively debug remote stored procedures written in Microsoft SQL Server's Transact SQL dialect, from within the Visual Basic development environment. Using the T-SQL debugger, you can:
In order to use the T-SQL debugger, you must have SQL Server version 6.5 with Service Pack 3 or later installed as your database server. The debugger uses the functionality exposed by SQL Server's Sdi.dll, and exposes that functionality through Remote Automation.
The client-side components of the T-SQL debugger are correctly installed and configured when you choose to install all the Enterprise tools in your Visual Basic installation. If it is necessary to repeat the setup process, select "Custom" from the CD Installation dialog box, and choose "Select All" for the Enterprise Tools selection.
With SQL Server version 6.5 and Service Pack 3 or later installed, you can install and register the SQL Debugger interface and Remote Automation component on the server. These components are located at \Program files\Common Files\Microsoft Shared\SQL Debugging. On Windows NT 4.0, simply run the setup program Sdi_nt4.exe.
Note For setup on NT Server 3.51, you must manually copy and register the necessary files. Complete instructions for this process are included in the Readme.txt file in the \Program Files\Common Files\Microsoft Shared\SQL Debugging folder.
There are different methods you can use to invoke T-SQL debugging.
Once you have selected the Automatically step into Stored Procedures check box, if you step into (F8) a line of code that executes an ADO or RDO method that invokes a stored procedure, the debugger will automatically be started. You can then step through the stored procedure and then continue debugging your Visual Basic code.
Note SQL Server will return from a stored procedure before it has finished executing if the stored procedure returns enough data to fill its buffers. If this happens, both the T-SQL Debugger and the Visual Basic debugger will be active at the same time. Your Visual Basic code must fetch the results from ADO or RDO before the stored procedure will complete its execution. If this happens, make sure your basic code reads the result sets by placing Visual Basic in Run Mode (F5) and setting breakpoints where you would like to stop execution. You can toggle back and forth between Visual Basic and the T-SQL Debugger by using the taskbar or using the ALT+TAB key combination.
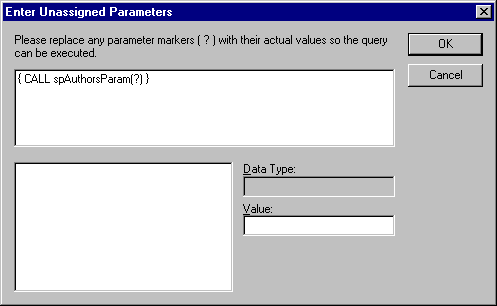
Once you have started the debugger, it establishes the ODBC connection and displays the Enter Unassigned Parameters dialog box, as shown.
Unassigned Parameters Dialog box

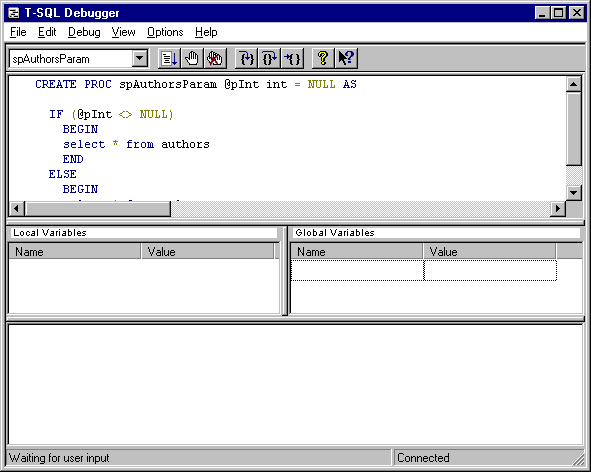
Enter values for any unassigned parameters in the Value field, then click OK. The T-SQL debugger interface appears and displays the text of the stored procedure:
T-SQL Debugger Interface

With the SQL statement displayed, several debugging options are available on the toolbar buttons and on the Debug menu. These options include:
In addition to the code window containing the SQL statement you are debugging, the T-SQL debugger interface presents separate output windows for local and global variables, and for the output (result set) of the query. The View menu also allows you to open a separate Call Stack window and a Temp Table Dump window, so that you can examine these as the code executes.
The Options menu lets you customize the appearance of the T-SQL debugger by changing the fonts and colors used for display.
When you are finished with your debugging session, click Exit on the File menu to close the debugger. To execute a query again, click Restart on the Debug menu.
If you are having problems getting T-SQL debugging to work, you will need to check the event log on the server. SDI.DLL will log events in the application section of the event viewer. COM or distributed COM errors will log events in the system section of the viewer.