You can use the MSChart control's three-dimensional chart features to lend a certain sparkle to a report.
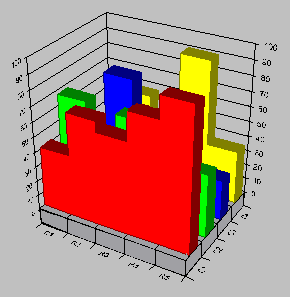
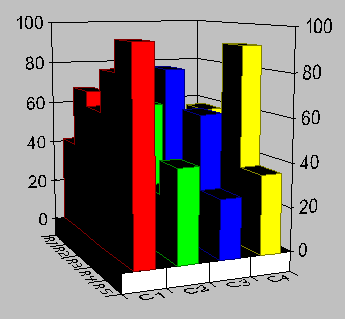
You can manually rotate a 3D chart by using the CTRL key and the mouse. To do this, hold down the CTRL key, click on the chart, then hold down the mouse as you drag across the chart image. The following figures show the same chart, before and after rotation.
Before Rotation

After Rotation

You can also rotate a 3D chart by using the Set method of the View3D object.
MSChart1.Plot.View3D.Set 10,100
In addition to rotating a 3D chart, you can also use the Light feature to control how a virtual light shines on the chart. In practice, the appearance of a chart changes as it rotates because its surfaces reflect steady light in continually changing angles.
By default, the chart comes with one LightSource. The following code will set the four parameters that affect the LightSource. These will be explained later. In the meantime, paste the code into a standard EXE project, and run it.
Private Sub Form_Load()
   With MSChart1
      .chartType = VtChChartType3dArea
      .Plot.Light.LightSources(1).Set 10, 10, 10, 1
   End With
End Sub
This code results in a chart that appears to have a light source shining on it from the lower left of the screen. As the chart is rotated, surfaces which face the light directly get brighter.
The LightSource feature is comprised of two parts:
Ambient light has a noticeable effect when you are using the LightSources. Ambient light simply bathes the chart evenly in a light that comes from no particular direction. You can set the AmbientIntensity property to any value between 0 and 1, with 0 turning off the light, and 1 increasing it to its maximum. For instance, to turn the ambient on to one quarter of its brightness, set the AmbientIntensity property to .25.
Tip As you experiment with the LightSources, it is useful to set the property to 0. With no ambient light, the effect of the LightSource is accentuated.
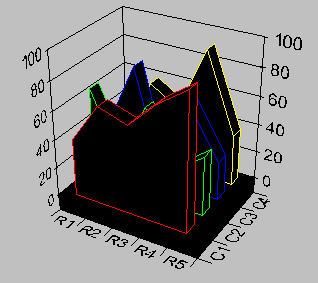
The EdgeVisible and EdgeIntensity properties work together to highlight the edges of the chart. When the AmbientIntensity is set to a low value, you can set the EdgeIntensity property to a high value. The result is that the edges seem to glow, as shown in the following figure:

Each LightSource in the LightSources collection has an Intensity property which — like the AmbientIntensity property — you can set to a value between 0 and 1. This property sets the brightness of the individual LightSource.
Each LightSource also can be positioned in the virtual space that surrounds the chart by setting the X, Y, and Z properties. By varying these properties, you can specify the direction from which the light will shine on the chart.
By default, the MSChart contains one LightSource member in the LightSources collection. You can, however, add LightSource members using the Add method, as shown below:
MSChart1.Plot.Light.LightSources.Add 10, 10, 10, 1
The parameters for the Add method include values for X, Y, and Z, which allow you to specify exactly the angle from which the light will shine, and a value for Intensity of the light.