Using the Debugging Windows
See Also
Sometimes you can find the cause of a problem by executing portions of code. More often, however, you'll also have to analyze what's happening to the data. You might isolate a problem in a variable or property with an incorrect value, and then have to determine how and why that variable or property was assigned an incorrect value.
With the debugging windows, you can monitor the values of expressions and variables while stepping through the statements in your application. There are three debugging windows: the Immediate window, the Watch window, and the Locals window
-
The Immediate window shows information that results from debugging statements in your code, or that you request by typing commands directly into the window.
Figure 13.8 The Immediate window

For More Information To learn more about the Immediate window, see "Testing Data and Procedures with the Immediate Window" later in this chapter.
-
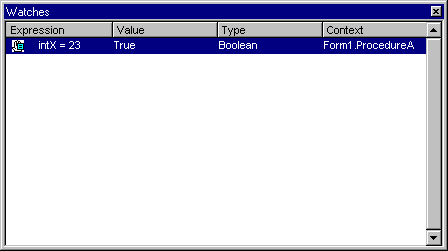
The Watch window shows the current watch expressions, which are expressions whose values you decide to monitor as the code runs. A break expression is a watch expression that will cause Visual Basic to enter break mode when a certain condition you define becomes true. In the Watch window, the Context column indicates the procedure, module, or modules in which each watch expression is evaluated. The Watch window can display a value for a watch expression only if the current statement is in the specified context. Otherwise, the Value column shows a message indicating the statement is not in context. To access the Watch window, select Watch Window from the View menu. Figure 13.9 shows the Watch window.
Figure 13.9 The Watch window

For More Information To learn more about the Watch window, see "Monitoring Data with Watch Expressions" later in this chapter.
-
The Locals window shows the value of any variables within the scope of the current procedure. As the execution switches from procedure to procedure, the contents of the Locals window changes to reflect only the variables applicable to the current procedure. To access the Locals window, select Locals Window from the View menu. Figure 13.10 shows the Locals window.
Figure 13.10 The Locals window

The current procedure and form (or module) determine which variables can be displayed according to the scoping rules presented in "Understanding the Scope of Variables" in "Programming Fundamentals." For example, suppose the Immediate window indicates that Form1 is the current form. In this case, you can display any of the form-level variables in Form1. You can also use Debug.Print to examine local variables of the procedure displayed in the Code window. (You can always examine the value of a public variable.) For more information about printing information in the Immediate window, see "Testing data and Procedures with the Immediate Window" later in this chapter.


