If you have data stored in an Excel worksheet, you can use the GetObject method to get a reference to the workbook that contains the worksheet, then retrieve the values using the reference. To first get the reference, the only argument needed is the path to the workbook, as shown below:
' Place this code in the Declarations section.
Option Explicit
' If you are using Office 97, be sure to set a
' reference to Microsoft Excel 8.0 Object Library.
' If you are using Office 95, set a reference to
' Microsoft Excel 5.0 Object Library, and declare
' the variable as a Worksheet.
Dim wkbObj As WorkBook ' Declare an object variable.

Private Sub Form_Load()
   ' Then set the variable with the GetObject method.
   Set wkbObj = GetObject _
      ("C:\My Documents\MySpread.xls")
End Sub
Note In order to use Excel objects, you must set a reference to the Excel Objects library. To do this, click the Project menu, then click References. Search for the Excel Objects library and double-click it. Click OK. Also, note that if you're using GetObject with the Excel 5.0 Object Library, you must declare the variable as a WorkSheet; if you are using the Excel 8.0 Object Library, declare the variable as a WorkBook.
After setting a reference to the Excel object library, you can use the reference to walk through the Excel object model, populating the array with data from the worksheet. To do this, use the Range method in conjunction with the Value property to get the data from any single cell in a spreadsheet.
Dim arrPrices (1 to 7)
Dim i As Integer
For i = 1 to 7
   ' Fill the array with seven values from column B of
   ' the worksheet.
   arrPrices(i) = wkbObj.Worksheets(1) _
   .Range("B" & i + 1).Value
Next i
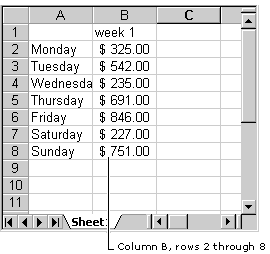
If you're not familiar with Excel spreadsheets, the following figure shows where the values are coming from.
Typical Excel Spreadsheet
The layout of a spreadsheet, and the method used to refer to its cells, also maps conveniently to the method of referring to data points in the MSChart control. For example, a "column" in a spreadsheet (as in column "B" in the preceding illustration) corresponds to a "column" in the MSChart. And when you create a multi-series chart, each column corresponds to a series. Similarly, the "row" of a spreadsheet corresponds to the "row" in a "column" in the MSChart. For this reason, it helps to engineer a chart with a spreadsheet in mind.
For example, just as we first created a multi-series chart by increasing the dimensions of the array, we can now fill the array by using more than one column of the worksheet. In other words, to create a multi-series chart, we fill two (or more) columns of the spreadsheet with numbers, and use the columns to fill an array, as illustrated in the following code:
Dim arrData (1 to 7, 1 to 2)
Dim i As Integer
For i = 1 to 7
   ' Values from column A fill the first series of the
   ' array. If these values are strings, they become
   ' the labels for the rows.
   arrData(i, 1) = wkbObj.Worksheets(1) _
   .Range("A" & i + 1).Value

   ' Then values from column B fill the second.
   arrData(i, 2) = wkbObj.Worksheets(1) _
   .Range("B" & i + 1).Value
Next i
Tip Use the CurrentRegion property to return the number of rows in an Excel column. You can then use this number to specify the upper bound of the array's first dimension.
The preceding code, used in conjunction with the spreadsheet shown in the figure above, will produce a chart that has each row labeled with the appropriate day of the week.