Debugging script allows you to find errors in your script, such as syntax errors, run-time errors, and logic errors, before you publish that script to the World Wide Web. You probably already know how to set breakpoints for debugging and how to step through lines of script. Now you can see how to accomplish these tasks using Microsoft® Visual InterDev™.
In Visual InterDev, debugging script consists of some or all of these steps, once you have added script to a page:
Debugging client script is an easy way to become familiar with debugging in Visual InterDev. Client-side script is processed on the browser, while server-side script is processed on the Web server. For more information about client and server script, see Debugging Client Script and Debugging Server Script.
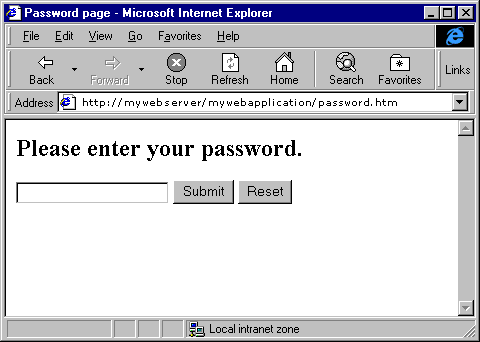
To use this walkthrough, you will need to create a file with script to debug. The sample client script, located between the <SCRIPT> </SCRIPT> tags in the example below, validates the length of password entries made in a simple form. The remaining HTML tags define the form and do not participate in the script debugging process.
To use the script below, create a new .htm file and switch to Source view in the HTML editor. Copy the script and HTML then right-click and choose Paste As Text from the shortcut menu. For more information, see Scripting with HTML Elements.
<SCRIPT LANGUAGE="JavaScript">
function validatePassword()
{
   var password;
   password = document.frm1.txtPassword.value;
   // debugger;
   alert("You entered " + password);
   if (password.length < 4) {
      alert("You must enter 4 characters or more!");
      document.frm1.txtPassword.select();
      return false;
   }
   else {
      alert ("Your form is being submitted!");
      return true;
   }
}
</SCRIPT>
<P><H2>Please enter a password.</H2>
<P>
<FORM NAME="frm1" METHOD="Post" ACTION="Process.asp" OnSubmit="return validatePassword()">
    <INPUT NAME="txtPassword" TYPE="Password">
    <INPUT NAME="btnSubmit" TYPE="Submit" VALUE="Submit">
    <INPUT NAME="btnReset" TYPE="Reset" VALUE="Reset">
</FORM>
Note JavaScript is case sensitive, so the sample script above must appear in your .htm file exactly as it does here.

When the user clicks the Submit button, the script checks that the password length is four characters or greater. The script generates a message box listing the password the user entered. If the password is four characters or greater in length, the user is then redirected to the page called by the Action element of the <FORM> tag.
If you haven't created Process.asp, the file that the form will call, the browser will display the "object not found" error. If the password is fewer than four characters in length, a message box appears indicating the character length requirement.
To specify a place in the script where you want to stop and examine the state of the process, you can use breakpoints. Breakpoints indicate the line of script you want to stop on in the application. You can then step through, step into, or step over lines of script individually to find errors. Breakpoints show up as red octagons to the left of a line of script in Source view.
Note To debug client scripts in Microsoft® Internet Explorer, you must be using Internet Explorer 4.0 and debugging must be enabled. For details, see the Internet Explorer documentation.
To set breakpoints
A red octagon appears to the left of the line of script.
Note You can also set or remove a breakpoint by placing the cursor in a line of script and pressing F9.
To launch the debugger
The Processes dialog box appears.
Microsoft Internet Explorer and your machine name appear in the Debugged Processes area.
The script executes until Internet Explorer reaches the breakpoint. When Internet Explorer reaches the breakpoint, it stops and displays the source script in Source view.
A yellow arrow superimposed over the breakpoint icon indicates the line of script where the debugger stopped.
For more information, see Breakpoints Dialog Box or Debugging Client Script.
To execute script one line at a time, you can use Step Into. After stepping through each line, you can view the effects of the statement by looking at the page in Internet Explorer.
To step into lines of script
<FORM NAME="frm1" METHOD="Post" ACTION="Process.asp" OnSubmit="return validatePassword()">
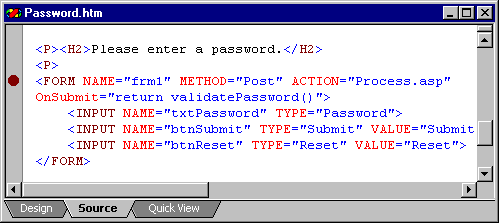
Note When you place a breakpoint in the line of HTML above, you are actually specifying that the script stop executing when you click the Submit button, OnSubmit="return validatePassword()".
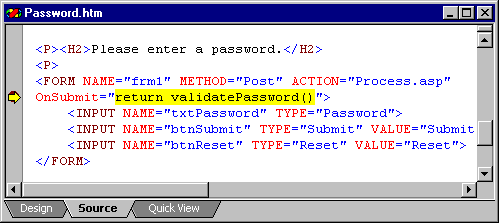
Internet Explorer reaches the breakpoint and switches to Source view. A yellow arrow appears superimposed over the breakpoint icon.
The following line of script is highlighted:
alert("You entered " + password);
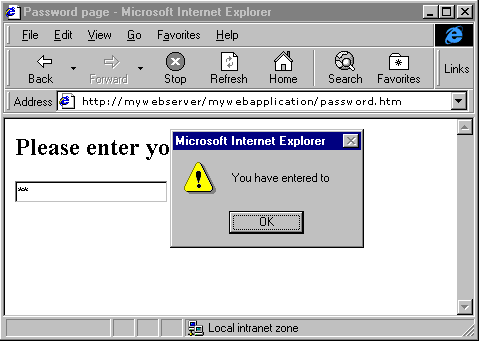
Internet Explorer executes the alert script and displays the message box.
Internet Explorer reaches the next line of script and switches to Source view.
You can continue stepping into lines of script and view the results in Internet Explorer.
To execute procedures in script as a single unit, you can use Step Over. Step Over allows you to skip a procedure or function and step through the next procedure or function.
After stepping over a procedure, you can view the effects of the procedure by looking at the page in Internet Explorer.
To step over lines of script
<FORM NAME="frm1" METHOD="Post" ACTION="Process.asp" OnSubmit="return validatePassword()">
Note When you place a breakpoint in the line of HTML above, you are actually specifying that the script stop executing when you click the Submit button, OnSubmit="return validatePassword()".
Internet Explorer reaches the breakpoint and switches to Source view. A yellow arrow appears superimposed over the breakpoint icon.
Internet Explorer executed the following script as a procedure unit:
password = document.frm1.txtPassword.value;
//debugger;
alert("You entered " + password);
if (password.length < 4){
alert("You must enter 4 characters or more!");
document.frm1.txtPassword.select();
return false;
Internet Explorer reaches the line of script after the procedure unit and switches back to Source view. For more information, see Debugging Your Pages and Stepping Through Code to Trace Execution.
You can assign variables in your script as you debug. You change the value of a variable from the Immediate window. When Internet Explorer reaches a breakpoint and switches to Source view, you can then change the value of a variable and view the results in the Locals window.
To change the value of a variable
<FORM NAME="frm1" METHOD="Post" ACTION="Process.asp" OnSubmit="return validatePassword()">
Internet Explorer reaches the breakpoint and switches to Source view. A yellow arrow appears superimposed over the breakpoint icon.
password="test"
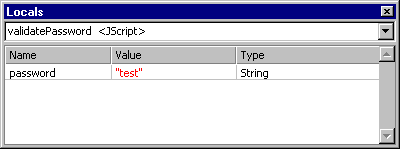
The Locals window displays the new value of the variable you entered in the Immediate window.
For more information, see Executing Commands and Evaluating Expressions in the Immediate Window and Viewing Local Variables in the Locals Window.