Visual Studio Analyzer helps you understand application structure, analyze performance, and isolate faults by providing several different views of your application. Visual Studio Analyzer constructs these views by monitoring your application as it runs, gathering information generated by COM, MTS, ADO, and other Microsoft technologies as your application runs, and then presenting that information to you.
The information that Visual Studio Analyzer gathers is in the form of events. An event, in the context of Visual Studio Analyzer, represents some kind of interaction or communication between two components in a distributed application. Function calls and returns from functions are Visual Studio Analyzer events, as are database queries, components starting and shutting down, and the like.
This section describes first how Visual Studio Analyzer sees your application, and then describes the reporting mechanism on which Visual Studio Analyzer relies to gather the events generated by the technologies your application uses.
Visual Studio Analyzer consists of a set of views on your application. The views are integrated into the Microsoft development environment (with Microsoft® Visual InterDev™ and Visual J++™).
Visual Studio Analyzer treats the components of a distributed application as a series of connected black boxes and focuses on the interactions between the components. For example, a Microsoft® Visual Basic® application might invoke a remote DCOM object and send some SQL statements to a database server. The application, the DCOM object, and the server would all be components that Visual Studio Analyzer displays graphically. Where two components interact (for example, the DCOM object and the database server), the interactions are events that Visual Studio Analyzer captures, saves in an event log, and presents to you in a view.
Some of the main views that Visual Studio Analyzer provides are the Block Diagram views, which are graphical representations of the distributed application that can play back the events that occur as the application executes.
You can use the Block Diagram views as high-level views of the application, giving you a place to start from. From the Block Diagram views you can open other views that provide detailed information about individual components and events.
Visual Studio Analyzer uses a set of event reporting interfaces to provide notification of the events between components. Each component in an application can use these event reporting interfaces. Many Microsoft technologies, such as ADO, COM, and MTS, are able to use these event reporting interfaces and will report Visual Studio Analyzer events without your needing to modify the components that invoke these technologies. In addition, the event reporting interfaces are available to you if you need to extend your application to report events of your own choosing.
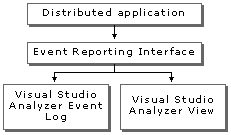
When an event is reported, the event reporting mechanism notifies any Visual Studio Analyzer views that are currently active. The event reporting mechanism also records the event and a timestamp in the active Visual Studio Analyzer event log. The following diagram shows how events are handled.
