Analyzing PerfMon Data
The following graph displays data from the Windows NT Performance Monitor (PerfMon) log of performance test data. This data was gathered on computer (4) shown in PT Test Architecture. Although you can watch PerfMon generate these usage curves during the test, you can also have PerfMon create them afterward from data it saved in the PerfMon log file.
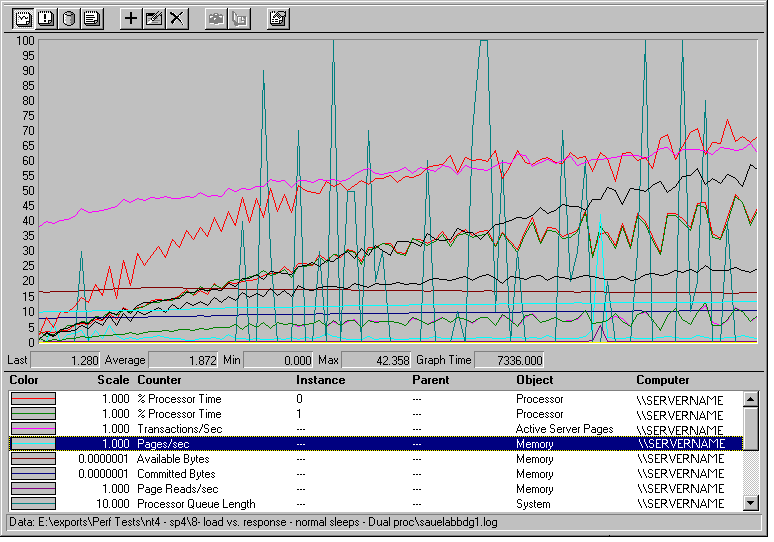
This graph shows the internal state of the PT application server computer (3) during the test in which the application ran on Windows NT 4, SP4:

This graph shows several PerfMon counters. You can use them to judge the state of the server computer during the test. Some of the counters that the testers monitored are described in the following list:
- Processor: % Processor Time (red line and green line together). This counter shows how much useful work the processor is performing. The % Processor Time counter represents the amount of current useful work, which is calculated by measuring the time the processor spends executing the thread of the idle process in each sample interval and subtracting that value from 100 percent. (Each processor has an "Idle" thread that consumes cycles when no other threads are ready to run.) During the entire test on the PT application, this counter did not exceed 50 percent. To gauge processor workload, view this figure in conjunction with the system processor queue length.
- Processor: Processor Queue Length (aqua line with spike). This is the length of the list of commands waiting for execution on the processor. Although the maximum length was 12, the average value was a low 1.6. You can tell by looking at this counter and the % Processor Time counter that these processors were not busy. It's difficult to account for the spikes in this curve, though they may correspond to the addition of groups of (fifteen) virtual users to the client load.
- Memory: Available bytes (dark red line). This counter indicates that about 170 MB of memory were available throughout the test. The very gradual decline in available memory is no cause for alarm.
- Memory: Pages/sec (blue-green line with multiple spikes). This is the number of pages read or written to disk to resolve hard page faults. A hard page faults occurs when a process requires data or code that it cannot find in the working set or elsewhere in physical memory and therefore must be retrieved from disk. This number should be consistently less than 50. For this test, the average value for Pages/sec was 1.87, although one unexplained spike (to 42.36) was seen.
- Web Service: Current Connections (upper black line). This counter represents the number of HTTP connections open at the moment, and it rose throughout the test as the number of virtual users rose.
Analysis of PerfMon Data
The system ran smoothly throughout the test and no bottlenecks were encountered. For these reasons, test data presented in PT Application Performance Test Results is probably reliable.

Note The Windows NT Resource Kit Version 3.5, available on Microsoft TechNet (Technical Information Network, Microsoft Corporation) provides the most comprehensive information about using Performance Monitor. See http://www.microsoft.com/technet.


