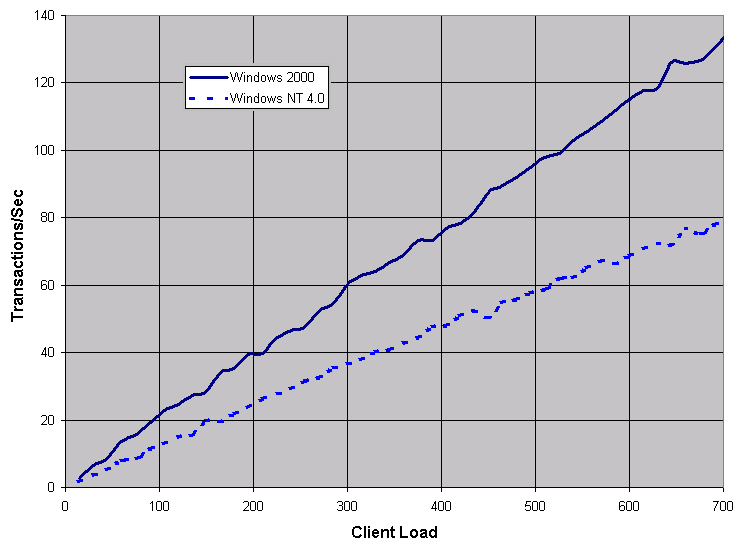
The following graph compares test results for the PT application running on Windows 2000 Server and on Windows NT Server 4.0 SP4:

The curves show application performance in transactions per second (vertical axis), for an increasing workload over the course of the test, expressed in virtual users ("Client Load," horizontal axis). As the number of virtual users increased, the number of server requests (specified in test scripts) increased correspondingly. The graph shows that as these requests increased, the number of transactions increased as well. Specific data about the internal state of the server computer is discussed in Analyzing PerfMon Data.
The test tool increased the workload by increments of fifteen virtual users. Although a given number of virtual users were active, not all of them were actively executing transactions The scripts of many were executing Sleep commands (see About Sleeps in Scripts).