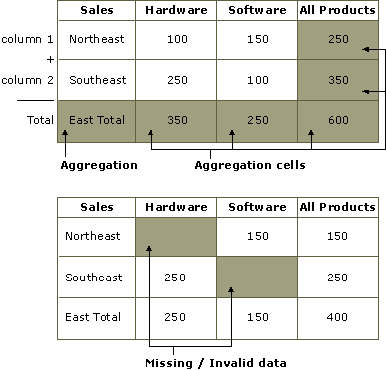
As noted earlier, precomputing aggregations is a key performance strategy for most OLAP products. However, preaggregation comes at a significant cost: The number of aggregations can easily outstrip the number of initial detail points, and the volume of data stored expands dramatically. The number of aggregations in an OLAP model is a function of the number of dimensions, the number of levels in the hierarchies, and the parent-child ratios. For more information, see the OLAP Report at www.olapreport.com.
Real-world examples of the effects of this data explosion abound. A recently published standard benchmark test of another OLAP product resulted in a data explosion factor of 240, requiring 2.4 gigabytes (GB) of storage to manage 10 megabytes (MB) of input data. Providing adequate disk storage to handle the huge expansion in data is a significant cost of large-scale OLAP implementations, and it creates distinct limits on the ability of an organization to analyze all the desired source-level data.

Because of data explosion, OLAP applications can suffer even more when the source or detail data is distributed sparsely throughout the multidimensional cube. Missing or invalid data values create sparsity in the OLAP data model. In the worst case, an OLAP product would nonetheless save an empty value. For example, a company may not sell all products in all regions, so no values would appear at the intersection where products are not sold in a particular region.
Reducing data sparsity is a challenge that has been met with varying degrees of success by different OLAP vendors. The worst implementation results in databases that stored empty values, thus having low density and wasting space and resources. OLAP Services does not store empty values, and as a result, even sparsely populated cubes do not balloon in size. While this issue is frequently highlighted by some OLAP vendors as a deciding factor in OLAP architectures, the differences between vendor implementations of sparsity management is minor compared to the more significant data explosion caused by precalculating too many aggregates.
Microsoft believes OLAP Services leads the market in offering a flexible solution that allows the OLAP database administrator to decide which storage model is most appropriate. OLAP Services supports a full MOLAP implementation, full ROLAP implementation, or a HOLAP solution. For example, a database administrator may opt to put frequently accessed data in MOLAP and historical data, which has more scalability problems, in ROLAP. However, the underlying data model is completely invisible to the client application, and its user perceives only cubes.
Whether one chooses to implement a MOLAP, ROLAP, or HOLAP data model, the integration of OLAP Services with relational databases is superior. OLAP Services maintains strong links between the source data, the OLAP multidimensional metadata, and the aggregations themselves by tying the graphical user interface design tools and wizards directly to OLE DB.
When implementing ROLAP data models, OLAP Services defines, populates, and maintains all of the relational database structures. This frees the developer from having to perform these tasks, or worse, from having to manage complex queries across multiple tables and servers.
Also, OLAP Services has minimized a fundamental problem of OLAP technology: data explosion caused by excessive preaggregation. As described earlier, OLAP data explosion is the result of multidimensional preaggregation. In traditional OLAP systems, data that has not been preaggregated is not available for reporting and analysis purposes unless calculated at run time. By precalculating and storing all possible combinations of aggregates (for example, the sum of all products and product levels across all time periods, across all organizations, across all distribution channels, and so on), traditional OLAP products create a massive data explosion.
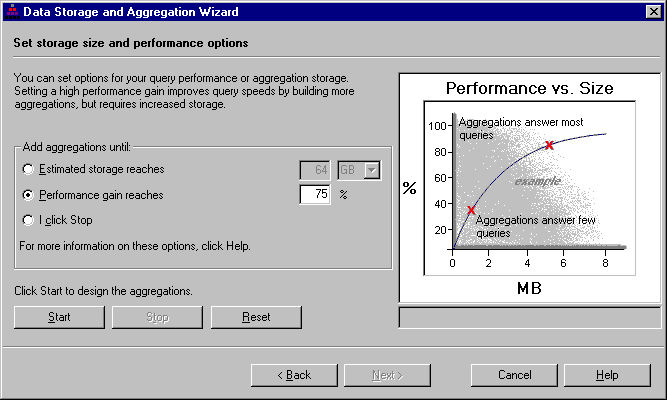
In contrast to the approach of calculating all possible aggregations, OLAP Services determines which aggregations provide the greatest performance improvements, but also allows the OLAP database administrator to make a trade-off between system speed and the disk space required to manage aggregations through the Storage Design Wizard. (See the following illustration.) If the developer were to precalculate all aggregations, disk space requirements would be maximized (hence the data explosion syndrome). On the other hand, if the developer were to precalculate nothing, disk requirements would be zero, but performance would not be improved.

In most cases, OLAP Services can gain about 80 percent improvement in query performance without excessive precomputation of aggregations (the exponential explosion of data typically occurs during the last 20 percent of aggregations). OLAP Services analyzes the OLAP metadata model and heuristically determines the optimum set of aggregations from which all other aggregations can be derived. The result is that OLAP Services derives nonaggregated data from a few existing aggregate values rather than having to scan the entire data warehouse. This strategy of partial preaggregation, however, is only the starting point.
Although the OLAP Services heuristics are excellent, they are based on mathematical models that may or may not correspond to actual usage patterns. To optimize performance according to actual usage patterns, OLAP Services optionally logs queries sent to the server. These logs then can be used to fine-tune the set of aggregations that OLAP Services maintains. For example, the Usage-Based Optimization Wizard allows the database administrator to tell OLAP Services to create a new set of aggregations for all queries that take longer than n seconds to answer (where n might be 10 seconds or more).
Disk space can be purchased whereas time cannot. If the extraction time of critical information outweighs the cost of purchasing more disk space, the solution is apparent.
The OLAP Services solution for data explosion reduces the time required to process initial loads and incremental updates, as well as minimizes the amount of disk space necessary. If an application begins with a 10-GB data warehouse and generates 10 GB of aggregations, then the processing time required is a fraction of that required to process the fully exploded set of aggregations.
OLAP Services also has taken an innovative approach to data sparsity. Although the details of the internal implementation are proprietary, the net result is that both MOLAP and ROLAP implementations manage storage requirements extremely well, often resulting in databases with smaller OLAP storage needs than the original detail data.
Virtual cubes can be used whenever the user wants to view joined information from two dissimilar cubes that share as few as one common dimension. Similar in concept to a relational view, virtual cubes are two or more cubes linked at query time along one or more common dimensions. One benefit of virtual cubes applies to situations in which data sparsity is a significant problem. For example, a cube that contains measures for sales by unit and selling price could also have a measure for list price to compute discounts, but the list price value would be repeated many times. By building a list price cube that is joined in a virtual cube with the sales by unit and selling price information, the database administrator can eliminate much of the data redundancy. The ability to create virtual cubes means that many unnecessary values can be eliminated from the OLAP data storage altogether.
The specific performance metrics of an OLAP application are a function of several factors, including database size, hardware computing power, and disk space allocated to preaggregated data. However, in real-world implementations, OLAP Services–based applications respond to most queries in less than 5 seconds and to nearly all queries within 10 seconds.
The OLAP Services implementation of partitioned cubes makes the technology highly scalable. A partitioned cube allows one logical cube of data to be spread over multiple physical cubes and even separate physical servers. In response to a user query, OLAP Services distributes the query among the partitioned servers, allowing the data to be retrieved in parallel.
For example, consider the case of an application tracking telephone calls for 10 geographic regions, where one would expect several million calls per day. For the purpose of analysis, one could partition the data among 10 servers, each containing the data for a particular region. From the user perspective, however, there is simply one logical cube of data. In response to user requests for this information, OLAP Services seamlessly transforms the queries as appropriate for each of the 10 servers and returns a single result set to the user. Each of the 10 databases is also available for separate access by analysts seeking information for that particular region.