We can't really say much about Performance Monitor unless we first give a brief overview of how you can view its data.
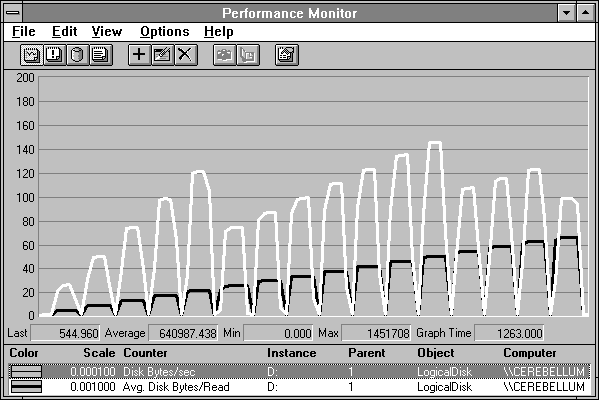
You can chart a counter. This will display the counter's values over time. You can chart many counters at one time. A chart of two counters is displayed in Figure 2.7. The horizontal axis is time.

Figure 2.7 Performance Monitor Chart view
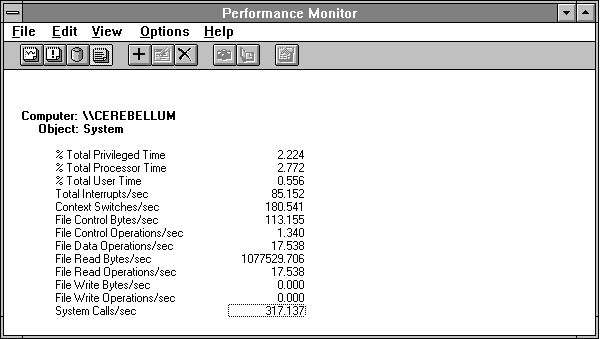
You can report on a counter. A report shows the value of the counter. You can create a report of all the counters in Performance Monitor. There are many; you'll have to scroll to see them all. Figure 2.8 shows a report.

Figure 2.8 Performance Monitor Report view
You can set an alert on a counter. This causes the display of an event when the counter attains a specified value. You can monitor many alerts at one time. Figure 2.9 shows some alerts.

Figure 2.9 Performance Monitor Alert view
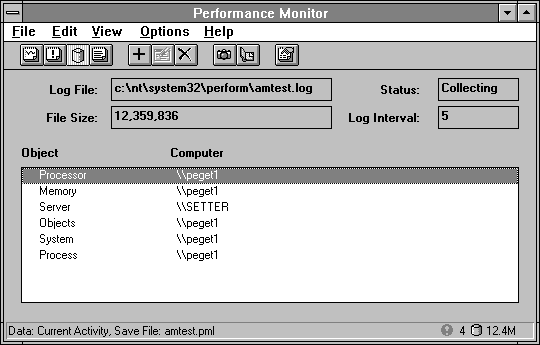
You can (best of all) log counters. Logging causes the counters to be recorded on disk for further analysis. You can feed log files back into Performance Monitor to create charts, reports, or alerts from the logged data—and that's just the tip of the iceberg. Figure 2.10 shows some data being logged.

Figure 2.10 Performance Monitor Log view
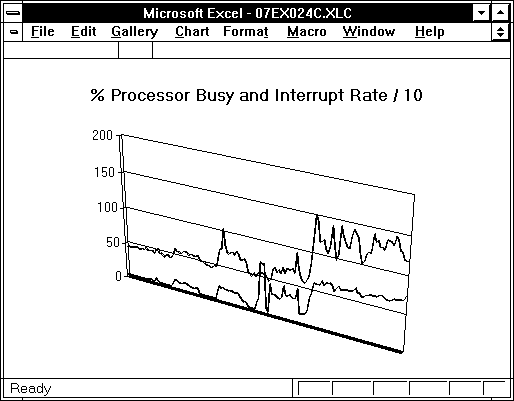
If this range of formats does not immediately meet your needs, you are a chronic malcontent. In this case you can export Performance Monitor counter data to other products such as spreadsheets and databases for further data reduction and analysis. Figure 2.11 shows an Excel chart of exported performance data.

Figure 2.11 Excel chart of exported Performance Monitor data