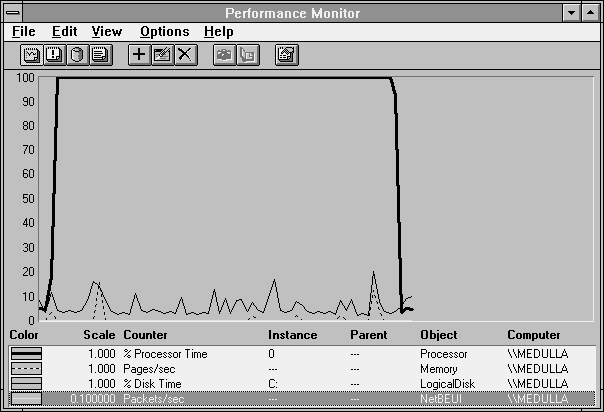
Let's first take a look at a simple processor bottleneck. Figure 3.5 shows a processor being used to maximum capacity for a while.

Figure 3.5 Bottleneck on processor utilization
Processor utilization is 100%. Most of our other overview counters are percolating at a low level. Why? Because we are logging the data, in this case at the rather rapid rate of once per second. The paging and disk activity is to the Performance Monitor log file. Later we'll discuss how to determine this. If we do not want this disk activity to interfere with the data, we could log over the network (then NetBEUI: Frame Bytes/sec would be non-zero), but because the disk activity is not really interfering much here, we won't bother this time. Chapter 2 discussed some other ways to reduce interference.
This interference is just the performance monitoring embodiment of the Heisenberg Uncertainty Principle: if you measure it, you change it. To make sure you don't forget this, we'll make it Rule #5!

We do not prevent you from collecting lots of data at a very high rate. There are occasions when you may legitimately need to look at something at very high resolution. But if you use Performance Monitor in such a way that it becomes your bottleneck, we'll tell your boss.
When we uncover a processor bottleneck, we always want to find out more. Is this just one process, or several? If one process, which one? And does it have just one thread, or several? Answers will tell us what we can do to solve the problem. This leads us to Rule #6.

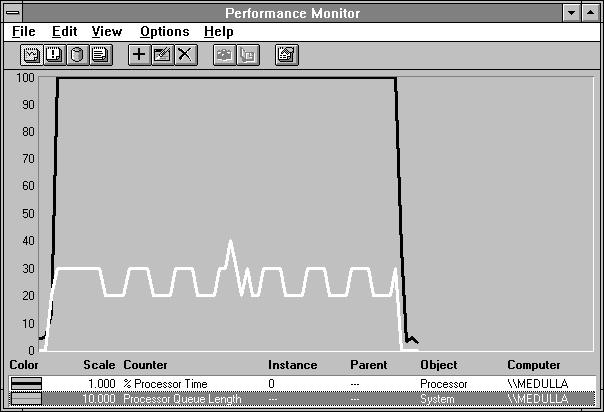
So the next step is to look at System: Processor Queue Length to determine how many threads are contending for the processor. Luckily we logged the Thread as well as the System object, so we get the picture in Figure 3.6.

Figure 3.6 Processor Queue Length with a processor bottleneck
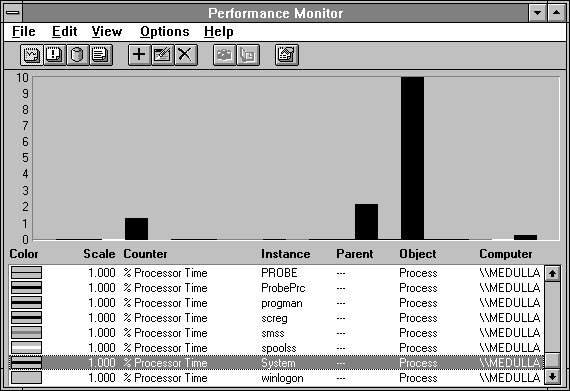
The Processor Queue Length here is scaled by 10 so we can see it better. It looks like it has a base of two, which alternates with three, with a peak at four. What are these threads? Figure 3.7 shows a chart in histogram mode, selecting the Processor: % Processor Time for all processes.

Figure 3.7 Processes active during a processor bottleneck
The culprits are cast appropriately in black. Here we have changed the Vertical Axis Maximum to 10. If we had left it at 100, you would have seen that the tall bar has 96.34% of the processor. So using this axis maximum lets us look at the remaining amount. On the left is the system graphics process, the Client-Server Runtime Subsystem (CSRSS) which has 1.408%. The bar to the left of the tall one is perfmon, the Performance Monitor executable, with 1.99%. The one on the far right is the System process, with 0.253%. It handles the lazy writing of data from the file system cache to the log file and other system functions. These processes are all involved in writing the log file. Heisenberg rides again! The overhead would have been lower if we had followed our own advice and minimized Performance Monitor while logging this data. You should try this and see if you can measure the improvement.
These values total 99.991% of the processor usage. The main culprit, of course, is the Response Probe process called ProbePrc, with 96.34% of the processor. If it were a real application, we'd rewrite it to use less processor time. Next we see perfmon, CSRSS, and finally the System process.
But Figure 3.6 has a strangely periodic, sawtooth flavor. In order to understand what we are seeing here, we need to digress for a moment and discuss how the % Processor Time is measured on Windows NT, and how the processor is scheduled. Then we'll know enough to pursue the Mystery of the Sawtooth Queue Length.