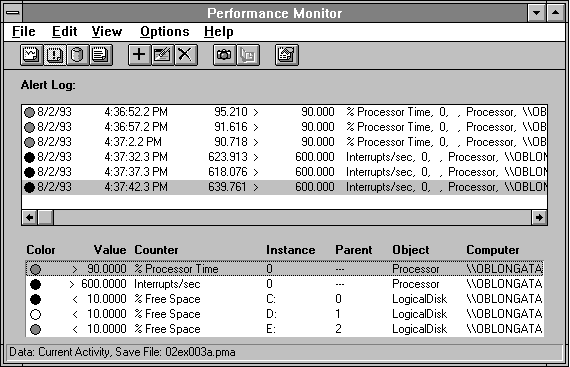
The Alert view helps you keep an eye on many counters with minimal overhead. This view is particularly useful for watching a large number of computers on a network.
You add counters in the Alert view much as you would to a chart or a report. But the Alert view has a few unique attributes.
For each counter for which you want an alert, you must supply a threshold value. For most counters, you want to be alerted if the counter becomes greater than some value. For a few, you want to be alerted if the value falls below a certain value. These are counters like Logical Disk: % Free Space, or Memory: Available Bytes.
In Alert view, the alerts you have created are shown in the legend at the bottom of the display. You can select an alert counter from the legend and change its properties, or press the Delete key to remove it. Use CTRL+G to toggle visibility of the legend.
When an alert is triggered, it displays a line in the alert log explaining the condition that caused the alert. The latest alert is at the bottom of the alert log, which can contain up to 1000 entries. After 1000 entries are logged, earlier entries are discarded as new entries are added.

Figure 2.26 Some common alerts and their alert logs
You can designate a program to be run either the first time or every time each different alert is triggered. This program receives the alert log entry on its command line, and the alert log entry appears in a Unicode™ space-separated format. What you have your program do at this point is quite open. It might log the data to some special database, activate a program on a remote computer, or even start another copy of Performance Monitor to monitor the condition more closely. For more information, see "The GUI Batch Processor," later in this chapter. (You should avoid starting a command-line batch file from this dialog box, since the > and < signs passed to the batch file will be interpreted improperly as a redirection of stdin and stdout.
You can also elect to have the alert placed in the system Application Event Log by selecting the Application Log option.
The alert condition applies to the value of the counter over the time interval you specify. The default time interval is five seconds. If you set an alert on Memory: Pages/sec > 50 using the default time interval, the average paging rate for a 5-second period has to exceed 50 per second before the alert is triggered.
If you select Manual Update mode instead of having data collected at intervals, the alert is checked only when you take a snapshot of the data. The interval in this case is the time since the last manual snapshot. As with the other views, you can take a manual snapshot between time interval snapshots to see if any alert conditions have been triggered.
When you monitor a remote computer, the performance data traverses the network each time interval, and the alerts are checked on the local computer. It would be more efficient to have a remote agent checking the alerts, and only sending the data if an alert condition occurs. To operate in this mode, use the Performance Monitor Service discussed below.
If you are looking for alert conditions on a remote computer, you will get a special alert should that computer cease to respond. You will get another alert when the remote computer comes back online.
You should use another copy of Performance Monitor to determine the overhead of your alert setup, and then increase your time interval until the overhead is acceptable.
You can configure your alerts to send a network message which will appear as a pop-up window at a chosen location on the network. The destination can be the name of a computer or the name of a user. If you choose the name of a user, the alert appears on the first Windows NT computer that user has logged on to, because the name must be unique in the network. Perhaps more practical is the use of an arbitrary name. Suppose you choose the name "PerfAlert." When you have chosen the computer that should receive the alerts, you can enter the following command on that system to receive the pop-up windows there:
net name perfalert
Caution Generating a large number of remote pop-ups is irritating to the recipient, who must close each one manually. Furthermore, the alert log is a fairly processor-intensive display to update because of the fancy spacing of the elements on each line. You should select your alerts so that pop-up windows do not flood the alerted computer, and so the alert log is not being updated rapidly, or you will be surprised at the processor overhead of using the alert feature. Because alert values are chosen precisely because they are urgent bottleneck indicators, this is not a real problem in practice, but is still worth noting.
You can choose the color assigned to an alert. When an alert is triggered and you are in another view, you can observe the colored alert icon in the status bar. The count of alerts since the last visit to the Alert view is also shown, along with the colored icon of the most recent alert. As you add alert conditions, the color advances automatically as an aid in distinguishing multiple alert conditions.
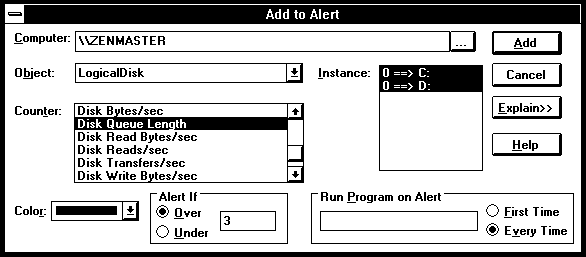
If you select multiple counters simultaneously, they must be similar in meaning because the same alert condition will be applied to each of them. (To set alerts on multiple counters with different thresholds, set the alerts one at a time.) It is, however, reasonable to add multiple instances at one time. Setting an alert on all Logical Disk: Disk Queue Lengths at one time is a reasonable operation, because the threshold could meaningfully apply to all instances. See Figure 2.27.

Figure 2.27 Setting an alert on multiple instances
You can clear the current alert data by choosing the Clear Display command from the Edit menu. This leaves your selections in place but starts the alert log over again from the top. You can clear all your selections and stop alerting altogether by choosing the New command from the File menu. This creates a new settings file.