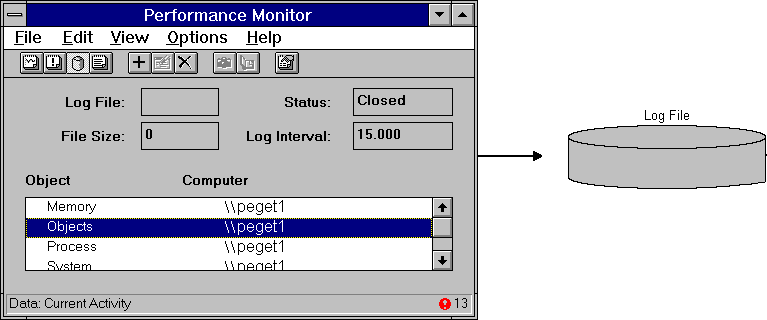
When you really get serious about looking for bottlenecks, or doing anything about capacity planning, or even looking closely at an application's performance, you're going to be logging the data, possibly in addition to using the other views. The log permits you to peruse the data at your leisure, rather than perform a complete analysis before the data disappears from the screen in real time.
Figures 2.28 and 2.29 diagram how logging works. You ask Performance Monitor to place data in a log file. When it is done writing data to the log, you can read that log file back into Performance Monitor. Now you can chart, report, alert, and even relog any portion of that log file. You can also export those views of the log file data for further reporting.

Figure 2.28 Creating a log file
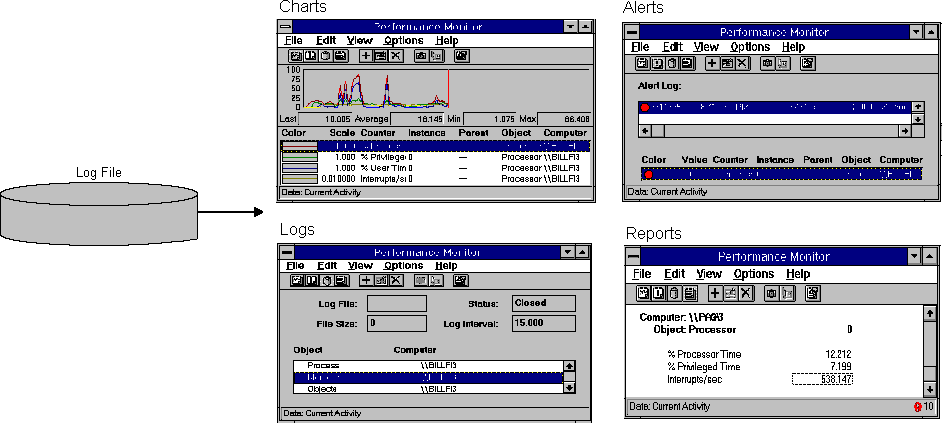
Figure 2.29 Analyzing data from a log file
To create a log file, switch to the Log view, and then choose the Add To Log command from the Edit menu to select objects to log.
In the Add To Log dialog box, you can log data from many computers into a single log file. This lets you see how the computers' activities correspond. All you have to do is enter the name of the computer you want to monitor. Choosing the ellipsis button brings up a Select Computer dialog box to aid in browsing the network for likely suspects. We discussed this earlier, as you may remember.
You can select one or more objects to log. Use the SHIFT and CTRL keys as you did for selecting multiple counters or instances. All the counters for all the instances of each selected object are logged. This means that you cannot log individual counters or individual instances. Trust us, this is okay.
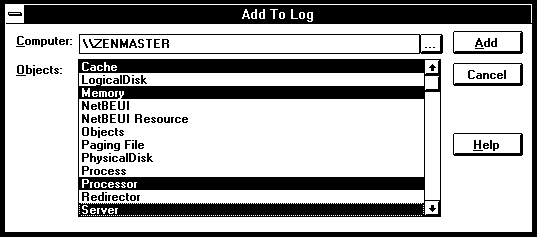
Figure 2.30 Add To Log dialog box
Once you have selected the computers and their objects to log, you can choose the Log command from the Options menu. This brings up the Log Options dialog box, which you can use to specify the name of the log file. This can be on a local computer or across the network. You can use the Network button to connect to a remote computer for logging to a remote file.
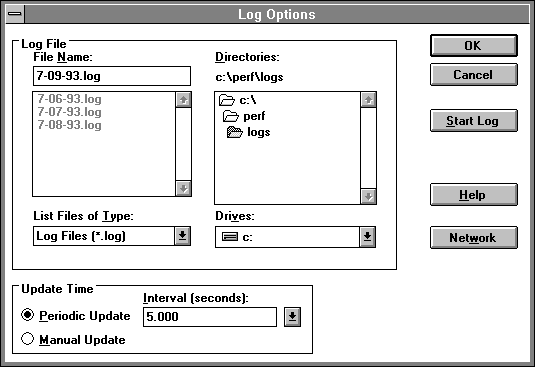
Figure 2.31 Log Options dialog box
If you specify the name of an existing log file, the new data is appended to the end of the log file. This is a powerful feature which permits the creation of long-term archives. We'll say more about this in Chapter 8, "Capacity Planning."
You can use the Log Options dialog box to change the time interval, which has a default of 15 seconds. You can also switch to Manual Update mode, but in this case nothing is logged unless you choose the Update Now command from the Options menu, or use the camera icon.
You must remember to press the Start Log button to start logging. If everything is set up right, the Log view then displays Status: Collecting. Otherwise, if you just press OK, you return to the Log view, but the Status displays Closed. If the status is closed, doing one or more of the following starts the logging process:
If your Start Log button is dimmed, go back and pick at least one object to log. Once you do that, Start Log becomes active.
To stop logging, choose the Stop Log button in the Log Options dialog box.
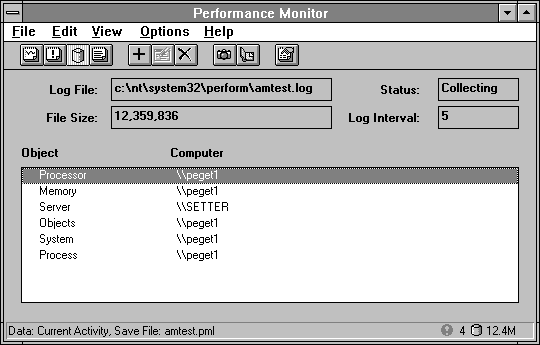
Figure 2.32 Log view during data collection
The Log view shows the name of the log file and the log status. Although it looks like an inactive window, you can click in the Log File box and use the HOME, END, and arrow keys to scroll through the log file name, if it is too long to see at once in the box. The Log view also shows the file size in bytes and the time interval in seconds.
You can change the time interval during logging without stopping the log file. So if you need to bump up the resolution, just do it! But remember, you are using more disk space, so lower it when you are done.
Because the log file size is displayed in the Log view, you can quickly determine how much data you are collecting on each snapshot. From the Options menu, choose Log and then choose Manual Update. Return to Log view by choosing the OK button. Click the camera a couple of times to take a couple of snapshots. Record the file size. Click the camera again. Record the file size. The difference is the amount of data collected in each snapshot. Now try it again to see if you get the same answer. If it's different, the reason is that Performance Monitor occasionally writes out an index record which you may not want to include in the size of every snapshot. This certainly occurs on the very first snapshot in the file, which is why we had you start with a couple of initial snapshots. (Counter names are also written with the initial snapshot.) These index records are infrequent; one is written every 100 snapshots.
Other information, in particular counter names, also appears at the start of the log file, and some new ones may appear when you add new systems to the log. We mention these details just for completeness.
By adding and deleting objects, you can determine the byte cost of each. Fun and games!
When you are logging data, you can use the Bookmark command from the Options menu command and its equivalent icon from the toolbar. These allow you to insert a comment into the Log File. Such comments can be used later as indexes to different points in the file. They help you to locate the start or end of interesting events you have logged. Use them freely, they are cheap. They automatically include the date and time, so don't bother to type those into your comment. If you append data to a log file by supplying the name of a pre-existing log file when you start logging, an automatic bookmark is placed at the start of the new data. It reads, "New set of Log data."
The current log file size appears on the status bar if you are collecting data, no matter what view you are in. Keep an eye on this. We're talking disk space here.
You can delete objects from the list of logged objects while you are logging. Select the object in the Log view legend and use the Delete From Log command from the Edit menu, or use the equivalent toolbar icon. After you do so, there will be no more data on that object until you add it back in. It is not terribly likely that you will need to delete an object, but you can.