Before diving in to understand any performance problem it is always best to take a step back and get the broad picture. When we first see a problem, we tend to try to solve it instantly. A common failing is to dive too deeply, too quickly, and thus miss the real problem altogether. We might backtrack and find it eventually, but we'll waste time. This gives us Rule #4.

On computers running Windows NT, there are a number of essential objects and counters for those objects you should check out first for any problem. We'll go into detail about these counters later, saying just enough here to provide an overview.
Consider building an OVERVIEW.PMW workspace settings file for each computer. In the following paragraphs we discuss useful counters to include in this file to monitor the computer's basic hardware components. To have Performance Monitor start up automatically using OVERVIEW.PMW whenever anyone logs on at the computer, do the following steps.
In the overview settings file, measure Processor: % Processor Time. This tells you how much processing is happening. If there is work being done and the processor is idle, you can be sure there is some other object causing delays. If you have a multiprocessor system, you might want to measure System: % Total Processor Time. This combines the average processor usage of all processors into a single counter. If you have many processors, this is the way to go.
You may want to measure System: Processor Queue Length. This is a key measure of processor congestion. We mentioned in the last chapter that you must include the measurement of at least one thread in order for this counter to operate. (Stop complaining: this is the type of knowledge that makes you an expert.)
The next counter to include in your OVERVIEW.PMW is Memory: Pages/sec. This tells you how many pages are being moved to and from the disk drives to satisfy virtual memory requirements. If the computer does not have enough memory to handle its workload, this counter will be consistently high. You will learn later how to distinguish between paging activity caused by program code and data accesses and paging caused by file accesses. Few computers have room for all their disk files in RAM, and paging allows code and data to get into memory initially. But sustained paging of code and non-file data because of a memory shortage yields particularly poor performance.
The next counter to include is Physical Disk: % Disk Time, for each physical disk unit. This will tell you how active the disk subsystem is. If there is excessive paging, it will show up as high disk utilization. General disk activity will also show up here.
Next to consider is networking. Here, what you measure depends on what protocol(s) you have installed on your system. It also depends on whether the computer is primarily a client, a server, or both.
If you are measuring a client and have NWLink installed, you can look at NWLink NetBios: Bytes Total/sec. If you have TCP/SNMP installed, you can look at Network Interface: Bytes Total/sec. If you have extended object counters for other protocols, they will probably have counters indicating total throughput. If you have extended object counters for your network adapter cards, you can look at byte transfer rates on those objects.
What you are looking for here is an indication of network activity, because on a client you usually deduce a network bottleneck rather than see it. For example, suppose that on a client, the processor and disk are not busy and the network is active. You are probably waiting for the network. If the problem is out on the network rather than in the local computer, it could be just about anywhere in the world, depending on your network. So let's try first to make the decision about local versus remote problems when we get the overview. We can search out the real culprit later.
If the computer is primarily a server, you might want to use Server: Bytes Total/sec to monitor your network activity. This will give you a single counter that shows most of your significant network activity. You will want to know how close the server's adapters are to being fully utilized. We'll discuss how to determine this below. It is also useful to watch Context Blocks Queued/sec and System: Total Interrupts/sec.
There are many other counters you could look at, but this set makes a pretty strong OVERVIEW.PMW. You don't want too many counters here because you want to get the broad picture. Once you have that, your chances of running off in the wrong direction are greatly reduced.

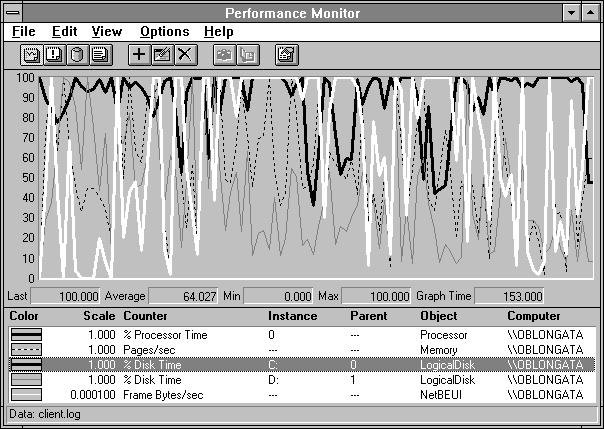
Figure 3.3 Overview of a busy client
What a jumble! Can we make sense of such a mess? (Yes, we can, as you'll see.)

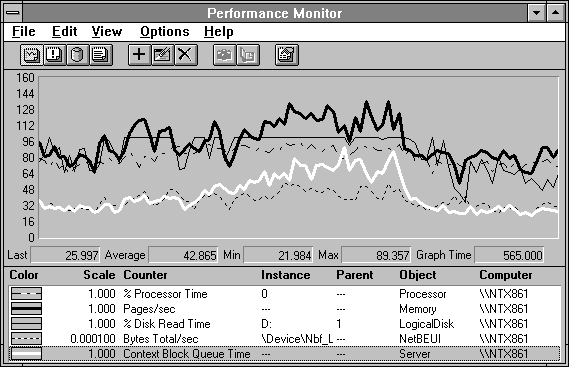
Figure 3.4 Overview of a busy server
That's one busy server! There is a memory bottleneck to the right of center on the display. Can you see it? Maybe not yet. This is the kind of problem we will learn how to solve.
These pictures can get pretty confusing, as even the simple example that opened this chapter showed, never mind these spaghetti charts. To get a better idea of how to approach more complex issues, let's look at each system component in turn, exploring how the counters behave under known, well-defined workloads. This will help us view the complexities of the real world from a platform of knowledge.