Now let's go back to the sawtooth behavior of the processor queue length. Now we know enough to understand that % Processor Time may not show the bottleneck. One reason is that some of the processes might be so quick that they do not register any processor usage. Another reason is that a process in the queue might never execute because higher priority processes are dominating the processor. The Processor Queue Length counter's Explain text tells us that this counter tracks the threads in the Ready State. If we want to know what is in the processor queue, we need to look directly at the threads and their thread states. All the possible thread states are listed in the following table.
Table 3.2 Thread States in Windows NT
Thread state | Meaning |
0 | Initialized |
1 | Ready |
2 | Running |
3 | Standby |
4 | Terminated |
5 | Wait |
6 | Transition |
7 | Unknown |
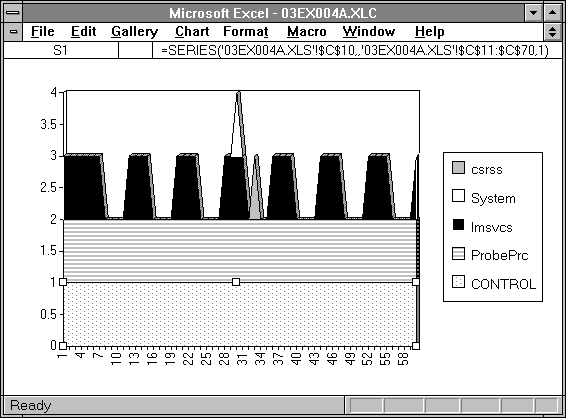
The easiest way to analyze what is happening in Figure 3.6 is to first bracket the time period of interest with the time window. Then add the counter Thread: Thread State for all threads in the system. This will take a while for Performance Monitor to draw, and the resulting picture is not too illuminating. However, we can now export the data and use a spreadsheet to analyze it. We look at the thread states of all the threads, and eliminate those threads that never have Thread State = 1 (that is, ready on the processor queue). We change all the thread states that are not 1 to 0, so the remaining thread state 1s really stand out. Now we can really see what's happening, looking at Figure 3.9.

Figure 3.9 Components of processor queue length
The ProbePrc process is our processor hog. The Control process is Control Panel, which attempts to wake up and do housekeeping about six times per second. Because it is in the background, it virtually never executesit is not getting enough of a priority boost to get much processor timebut it sits on the processor queue trying to run. The System process is rarely queued, mainly because it runs briefly when it runs. CSRSS is rarely active when Performance Monitor is actually retrieving data. It updates the log file size after the data is written to the log file, and that is way after the data is collected and the Processor Queue Length is observed.
We can now see quite clearly that the sawtooth queue length is caused by the periodic nature of the LAN Manager Services (LMSVCS) process. LMSVCS handles the Server, the Redirector, the Browser, some TCP/IP functions, and so on. This process has a thread that wakes up to do housekeeping once per second. If it cannot run right when it wakes up, it goes into the processor queue. Now that we know what to observe, we can look at this thread in more detail.

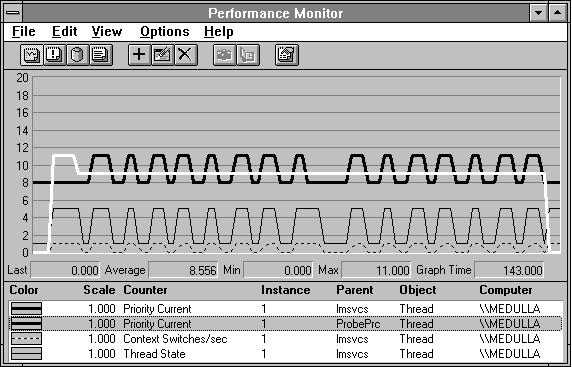
Figure 3.10 Anatomy of a periodic, blocked thread
Figure 3.10 shows where the sawtooth comes from. The heavy black line is the Thread: Current Priority of LMSVCS thread 1. It starts at 8, below the highlighted foreground priority 9 of the Response Probe process, ProbePrc. It is in Thread State 1, Ready. After a while, the system boosts the priority LMSVCS thread 1 to 11 so it can get some processor time. At this point several things happen at once. The thread state switches to 5, because the thread is usually idle when the snapshot is taken. The Thread: Context Switches go from 0 to 1 per second. (A context switch is when the processor switches from executing one process or thread to another.) After some of this level of activity, the thread is returned to its base priority of 8. The next time it tries to wake up, it goes onto the processor queue, and the cycle repeats. We have solved the mystery of the sawtooth.
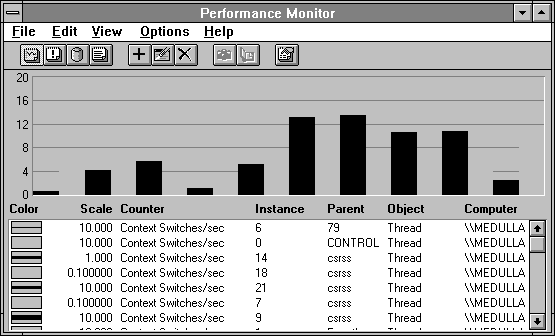
The threads that are observed to be busy when there is a long processor queue may not be the ones that are in the queue. This may be because they are too quick to be seen by the timer interrupt that is sampling the processor usage, or they may be at too low a priority to capture any processor cycles, in spite of any priority boost. The next figure shows the threads that are observed to be getting processor cycles during this experiment. Note the use of scale factors to show all these threads on one chart.

Figure 3.11 Threads active during a processor bottleneck