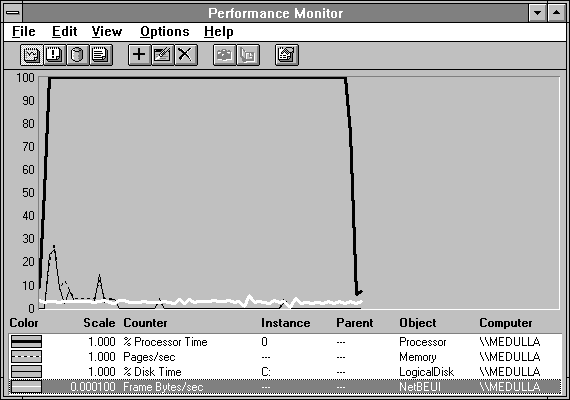
In this last example, we saw what the system looks like when we have a single process that is hogging a single processor. What if we had more than one process active? This is visible in the next few figures, starting with Figure 3.15.

Figure 3.15 Multiple processes in a processor bottleneck
Contrast this with Figure 3.5. The only change is in the background activity, and this is different because we have decided to place the log file on a remote computer, instead of on the local disk. We thought you would like to see the difference in usage this would cause. After some initial activity, the disk becomes quiet, and you see a steady stream of NetBEUI Frame Bytes/sec (the white line at the bottom). We are still logging this data at a one-second time interval. (This is a very high rate for logging. Except for making illustrations like this, we do not recommend it.)
To see how this situation is really different from Figure 3.5, we can compare Figures 3.6 and 3.16, which show the processor queue length.
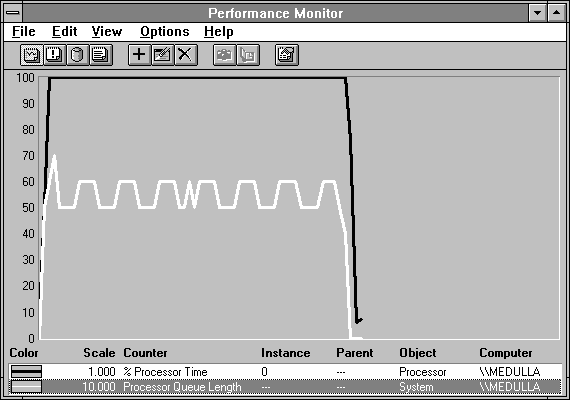
Figure 3.16 Processor queue length with multiple processes consuming the processor
The highlighted queue length in Figure 3.16 is much longer than the one in Figure 3.6. It goes as high as 7 and never drops below 5. Suppose we find the average queue length in each case. Let's start two copies of Performance Monitor, each looking at its own log file. We move the time window in on each one to bracket the time when the processor is 100% utilized. Then we select the Processor Queue Length in the legend, and note the average value in the value bar. See Figure 3.17. The average values are 2.5 in one case, and 5.5 in the other. So we would guess there are three more processes in Figure 3.15 than in Figure 3.5.
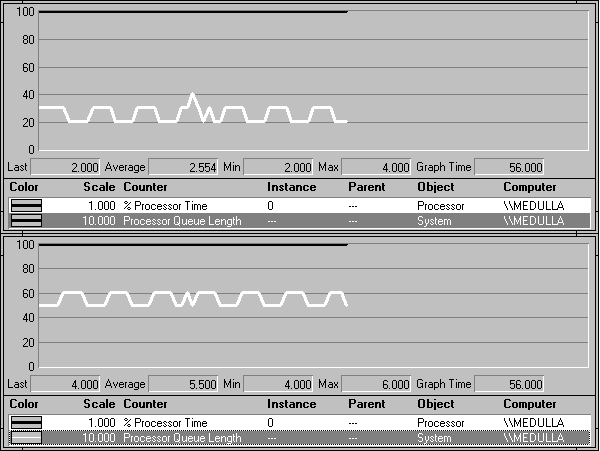
Figure 3.17 Comparing processor queue lengths
This is a certain clue that there is more than one culprit hogging the processor. What are these masked processes? We expose them in Figure 3.18.
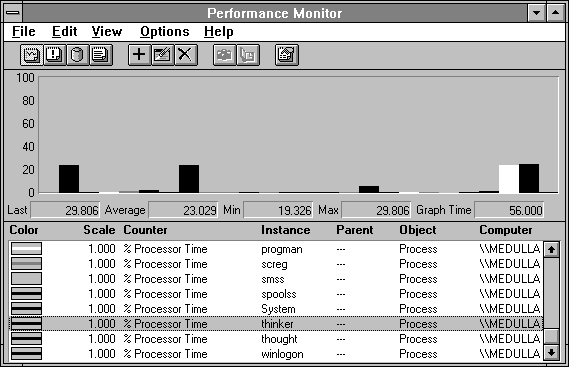
Figure 3.18 Which processes are eating the processor
Clearly, four processes are consuming the processor in this case. They are sharing it equally. We see minor usage by two others, the CSRSS and Performance Monitor. So, we have found the bottleneck!
How would this look different if we had just one process, but with multiple threads? At this point you can probably guess. Take a look at Figures 3.19 through 3.22. This time we have placed Performance Monitor on a remote system. You see the same network traffic in the background that you saw last time. But Performance Monitor is remote. We can see the consequence of this indirectly in Figure 3.20.
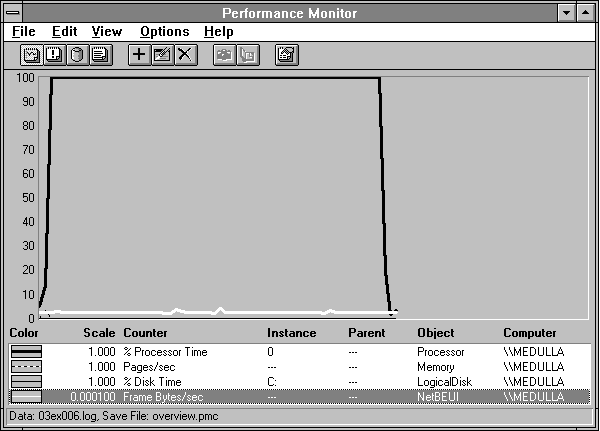
Figure 3.19 Processor consumption by multiple threads
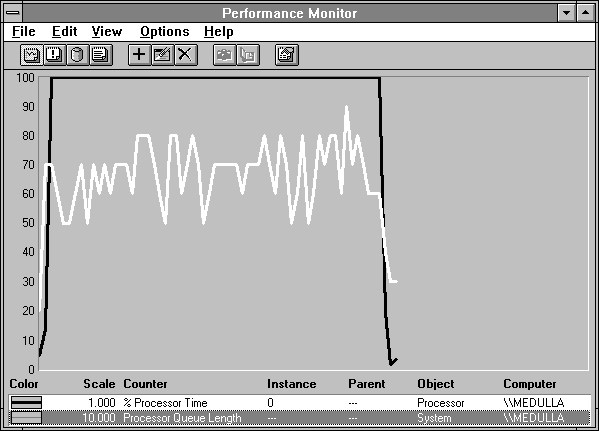
Figure 3.20 Processor time and queue length with multiple threads (remote measurement)
The Processor Queue Length is more erratic and longer than before. We can analyze this as we did previously, by exporting the Thread: Thread State for all threads, and finding those with Thread State 1 (Ready). What we see is that there are two new, multithreaded processes participating when we do remote measurement. The first is the Network Server, which lives in the services process. The second is the Windows Logon process (WINLOGON). Both participate in handling the remote request for performance data, and both have multiple asynchronous threads that contribute erratically to the queue length.
So we've muddied the waters a little by changing both the way we are collecting the data as well as the experiment itself, in violation of Rule # 1 of Bottleneck Detection. But this way we've convinced you of the value of Rule #1, right?
You can look at Figure 3.21 to see which processes are participating in this bottleneck, and you can see from Figure 3.22 that the Thinker process has four active threads.
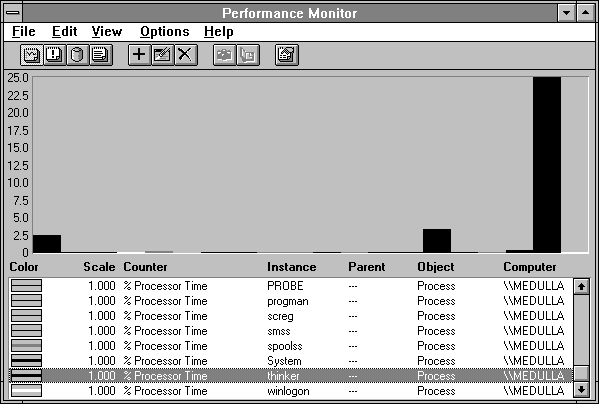
Figure 3.21 Processes in a multithreaded processor bottleneck
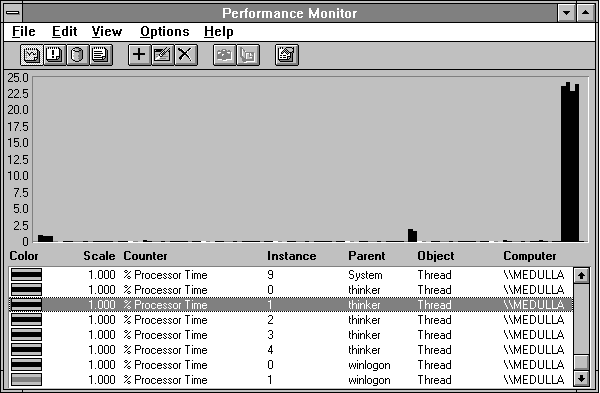
Figure 3.22 Threads in a single process in a multithreaded processor bottleneck
What you want to remember is that although we tend to think of processes as the executing programs on a system, it really is the threads that use the processor. The process is the address space, and the threads inside that process share that address space and actually execute the instructions.