First let's review the important point we covered briefly in Chapter 2: you must run the diskperf utility to activate disk performance statistics on your computer. To activate disk performance statistics on the local computer, type the following, and shut down and restart the computer.
diskperf -y
To activate disk performance statistics on a remote computer, specify the computer name when you start diskperf; for example, to collect statistics on a computer named AARDVARK, you would type:
diskperf -y \\aardvark
After typing this, you must restart the remote computer before disk statistics are collected.
You must be a member of the Administrators local group on a computer to run diskperf on it.
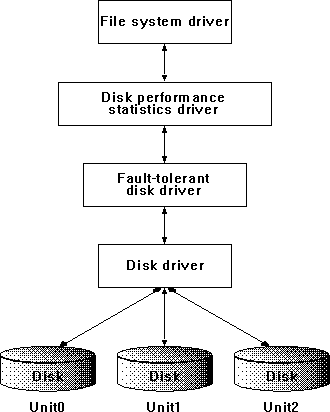
The diskperf utility installs the disk performance statistics driver, DISKPERF.SYS, in the I/O Manager's disk driver stack. See Figure 4.1, showing the stack with the disk performance statistics driver installed.

Figure 4.1 Disk driver stack with disk performance driver installed
The reason we put you through the bother of installing diskperf manually is because it causes a little performance-degrading overhead that you may not always want. Let's use Response Probe to do a quick experiment to see if it's worth it.
Note By the way, be sure when doing these experiments to let your Windows NT computer settle for a while after logging on. Various background startup activities can interfere with your experiment. You might also want to disconnect the network if it is not involved in the experiment. Network drivers may respond to network events even if they are not directed to your computer.
By setting the FILEACCESSMODE parameter in Response Probe to UNBUFFER, we are guaranteed to bypass the cache and go directly to disk. (For more information about Response Probe and its parameters, see Appendix C, "Using Response Probe.") We'll set up Response Probe to do 100 reads of 512 bytes from a file. We want to transfer a small amount of data because we want to see the maximum distortion caused by the diskperf overhead. Unbuffered access to disk must be a multiple of a sector in size, so 512 is as small as we can go.
We'll use a file that is 100K in length. To create the file, we'll use the createfil utility, which is on the floppy disk provided with this book. To create a 100K file with the name FILENAME.EXT, type:
createfil filename.ext 100
We'll set the Response Probe FILESEEK to a mean of 100 and a standard deviation of 30. Because this is in units of 512-byte records, it means our accesses will be normally distributed around a point near the middle of the file. It is a property of normal distributions that about 99% of the access will be within plus-or-minus 3 standard deviations, so we should get a nice bell-shaped distribution of accesses across the length of the file. (For more information about using bell-shaped distributions in Response Probe experiments, see Appendix C of this book.)
On our 486 computer with a 50 MHz clock, we get consistent average times from Response Probe of 1666 milliseconds for the 100 reads, or 16.66 milliseconds/read, with diskperf enabled. This is probably close to the rotation time of the disk. The standard deviation of the response time to the 100 reads is 1 millisecond, so this is a very repeatable experiment. With diskperf disabled, we get the same number: 1666 milliseconds. There's no visible degradation in performance! So why did we make diskperf optional? Because if you do this same experiment on an 386 20 MHz computer, you see a degradation in disk performance of about 1.5%. On a 386/25SX laptop computer we observe a 0.9% (nine-tenths of 1%) degradation in disk throughput. Because we don't know what sort of system you are going to place Windows NT on, we prefer that you elect whether to collect disk performance statistics, rather than force you to do so by default.