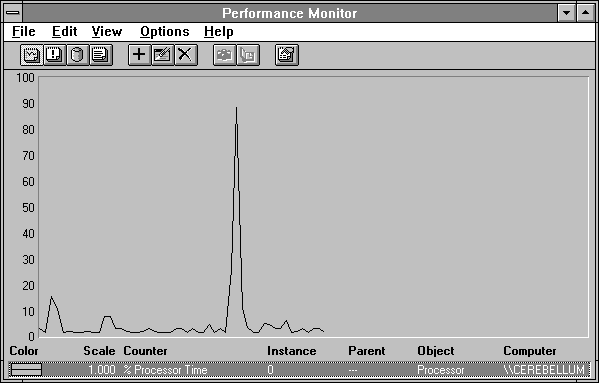
This has been a fairly abstract discussion, so let's look at some concrete examples. We'll start Clock, a Windows NT accessory, and see what kind of memory activity occurs. Starting applications is relatively quick, so we'd better log at one-second intervals if we want to see what's happening. We'll let the system settle down for a few seconds, and then choose Clock from the Accessories Group.

Figure 5.2 Processor activity while starting Clock
Now let's add Memory: Page Faults/sec to the picture in Figure 5.3, it's the thick black line. There are two bursts of page faulting, a large one followed by a small one.
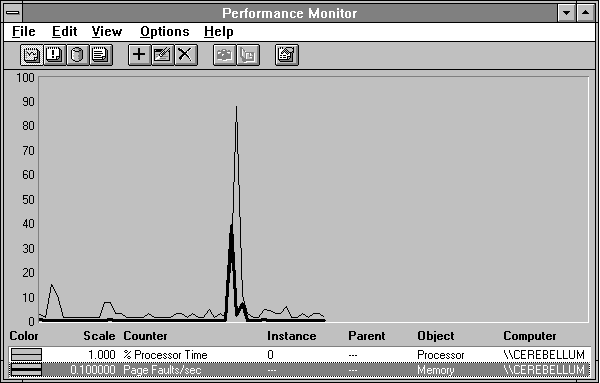
Figure 5.3 Page faults while starting Clock
Because page faults may not involve peripheral activity, it is important to look at how many of these pages faults actually resulted in pages coming in from the disk. In the next figure we have Page Faults/sec in a solid black line, and Pages Input/sec in a dashed line. During the first peak of activity, there is a lot of page fault action that does not result in disk activity. In the second peak, however, every page fault seems to need a new page from disk.
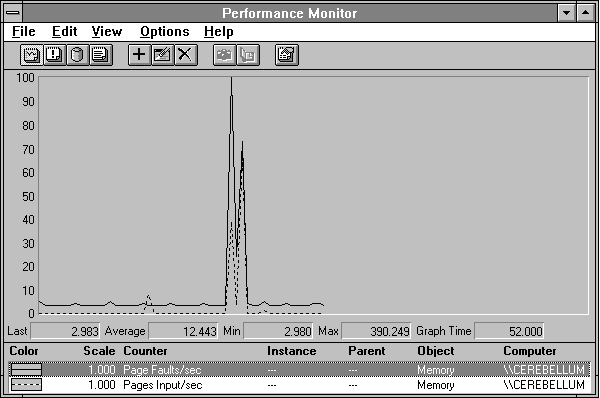
Figure 5.4 Pages input while starting Clock
In the next figure, we can see how many times per second the memory manager asked the disk driver for pages. We can see that this is less than the number of pages input. The memory manager is asking for multiple pages on each request to the disk driver. We told you the memory manager was tricky!
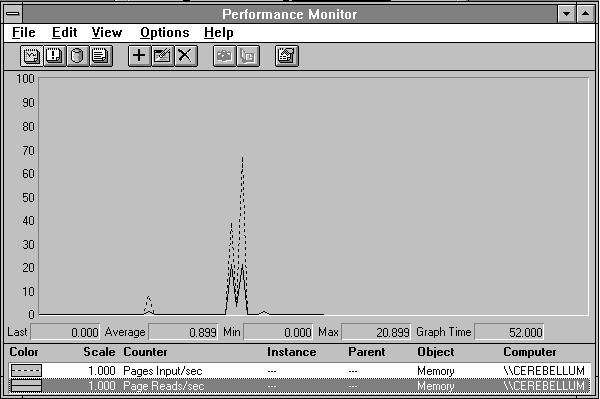
Figure 5.5 Page reads while starting Clock
Presumably Clock causes all this activity, but we'd better check. We can switch over to Report view and look at page faults committed by all the processes. When we do this we see there are three processes that have page faults during this time: Program Manager, Clock, and our old buddy CSRSS. Their faults are charted in Figure 5.6. Clock is highlighted, Program Manager is the thick black line, and CSRSS is the thin black line.
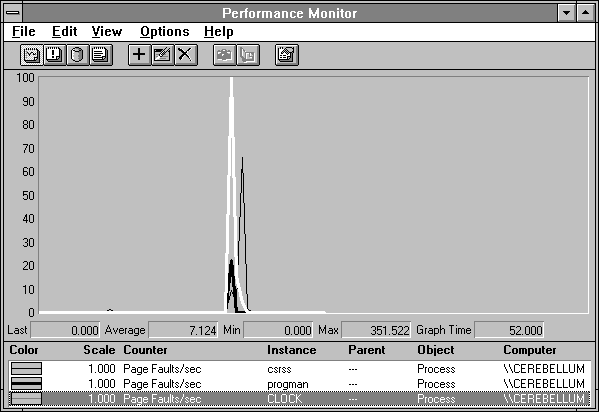
Figure 5.6 Page faults by process while starting Clock
Now we are getting somewhere. First, the little blip on the left is CSRSS. These page faults occurred when we switched focus to Program Manager to get ready to select Clock. Apparently not all the pages needed to perform this action were in the CSRSS working set at that point. It is also clear that the first peak of page fault activity was caused by Clock and to a much lesser extent, Program Manager. During this period we saw that most of the pages faulted were already in memory and we did not have to go to disk for them. How can that be? Clock is likely to use a lot of system windows and graphics routines which are already in use by other processes. These get put into the Clock working set through the page fault process, but they are probably already in memory because other processes are using them.
CSRSS is generating a few page faults during the first peak, but it is largely responsible for the second peak. Because we saw that page faults and pages input were closely correlated during the second peak, we can deduce that the pages that CSRSS needed to bring in to handle the Clock startup were not in memory. This makes sense, really, because Clock uses a very large font for its digits, and such a large font is not likely to be lying around in memory.
Now let's look at the disk activity this set of actions causes. We'll narrow our focus to the period of active paging, and look at some memory and disk statistics.
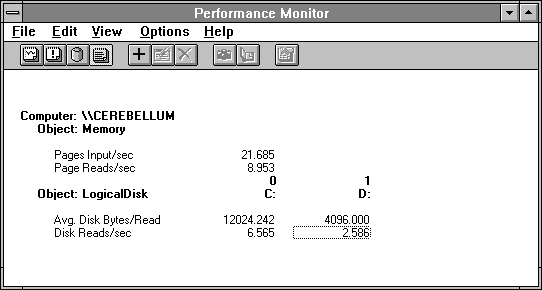
Figure 5.7 Memory and disk reports when starting Clock
By adding the values of LogicalDisk: Disk Reads/sec from the two drives involved we see their sum is just a little higher than the value of Memory: Page Reads/sec. On drive C we are reading almost 3 pages (12K) on every read request. Multiplying three times the Disk Reads/sec and adding the drive D Disk Reads/sec, we get the total Pages Input/sec of 21+. So the paging statistics from the disk and memory are pretty closely related. Close enough for bottleneck detection, according to Rule #9. We had narrowed the time window down to five seconds here, so we have brought in about 105 pages.
But we're just getting started! Let's take a look at the working set sizes of these processes. If they are faulting in a lot of pages, they are probably increasing their working sets. Figure 5.8 shows the working set sizes for each process that is causing page faults.
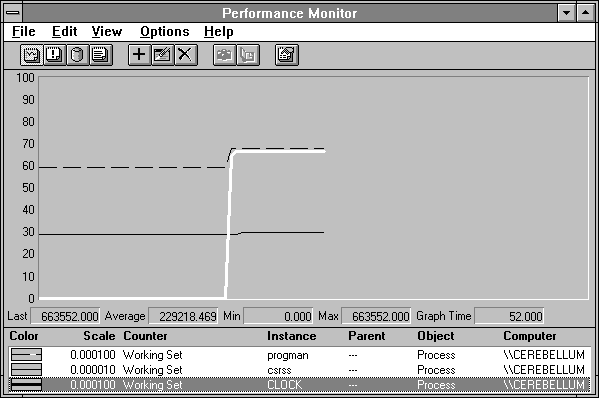
Figure 5.8 Working set size growth when starting Clock
Pay close attention to the scale factors used in this chart. Both Program Manager and Clock have working sets that rise to about 600K, but CSRSS is up to nearly 3 MB. Sure enough, the working set sizes rise just as one might expect. At the start of the test, Program Manager has a fair number of pages lying in memory. The first thing that happens in our experiment is Program Manager brings into its working set whatever pages are required to launch Clock. Total growth in working set is 84K (21 pages), which we can calculate by subtracting the Minimum from the Maximum on the value bar when selecting Program Manager.
Then Clock, starting at ground zero, brings in its working set. A lot of these pages were already in memory, and are just being added to the Clock's working set so Clock can share them. Or perhaps they are fresh data pages that Clock needs, in which case the memory manager will provide Clock with a zeroed page frame, which also does not require disk input.
As soon as Clock starts to use CSRSS to draw the large numerals on the clock face, CSRSS starts to bring in its pages. Although it looks like CSRSS has not increased much here, in fact it looks that way because its scale factor is ten times smaller; it has grown here by 88K, or 22 pages. Recall from Figure 5.4 that most of the CSRSS fault activity resulted in real pages from disk. Because we faulted in a total of 105 pages and we know that 22 went into CSRSS, we calculate that 83 went in to Clock and Program Manager. Because we know that Program Manager's working set grew by no more than 21 pages, that leaves at least 62 pages brought in from the disk by Clock itself.
Can these processes really need all this space? Perhaps not all at once. The memory manager lets processes grow their working sets until memory pressure develops. This is indicated by the decline of another key counter, Memory: Available Bytes. In the next figure we add Available Bytes to the above chart to see how much free memory we have before and after the test.
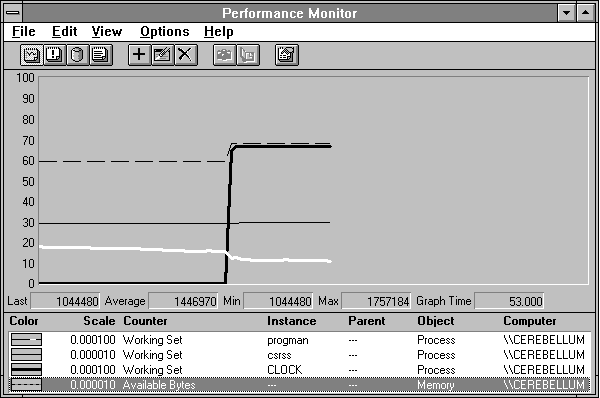
Figure 5.9 Available bytes decline when Clock starts
From the value bar you can see that Memory: Available Bytes starts at about 1.7 MB and ends right near 1 MB. When Memory: Available Bytes gets too low, the memory manager begins to take pages more aggressively from the working sets of inactive processes. It also makes different choices in which pages it replaces. Instead of allowing the working set of a process to grow and use up the remaining free memory, it takes pages from other parts of the working set of that process.
This is a change from a global page replacement policy to a local one. When enough space becomes available, the memory manager again reverts to global replacement. On a Windows NT Server computer, you can fine-tune at which point this transition occurs. To do so, choose the Network option in Control Panel, and then select Server in the Installed Network Software list and choose Configure. You can play with the various options, but for normal system use we recommend using the Balanced option. We ran this experiment on a server system tuned to Maximize Throughput For File Sharing. We'll discuss the implications of the settings when we cover cache behavior in the next chapter..
Until memory pressure is significant, working sets grow and you can't tell by looking at them how much space they actually need. But we can create memory pressure, and we can empty memory fairly effectively with a little utility we call clearmem. The clearmem utility, which is on the floppy disk provided with this book, determines the size of your computer's RAM and allocates enough data to fill it. It then references all this data as quickly as possible, which will toss most other pages out of memory. It also accesses files to clear the cache, in case that is important to you. Let's run clearmem on a system after we start Clock and see how large the working sets are after we have taken away all the unused pages.
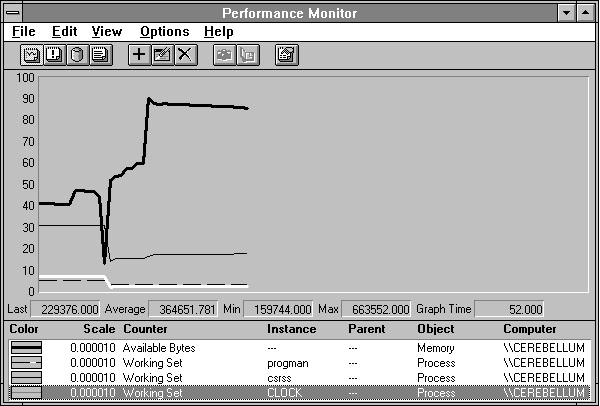
Figure 5.10 Working sets reduced to operating minimums by the clearmem utility
You can see Available Bytes, the thick black line, really climb as a result of clearmem. Clock, highlighted, is reduced from its initial 648K to 224K. That's quite a difference. Program Manager has followed a parallel path. CSRSS has dropped back to 1.7 MB, about half the space it occupied previously.
So we can see that the working sets were much larger than they needed to be to run Clock (and Performance Monitor). Isn't all this inefficient? No, it's not. The memory manager constantly makes tradeoffs between using the processor cycles to keep working sets trimmed up, and not using those cycles when it is not necessary. If there is plenty of memory, there is really no point in consuming processor time to trim working sets. You can see from this figure that, when memory is in demand, the trimming process occurs in high gear.
Let's return to the issue of starting Clock. We have left something out. We brought in a bunch of pages. It looked like they went into free page frames, because we saw the Available Bytes drop. But we have looked only at pages brought in to memory. What about the pages memory manager ejects? Figure 5.11 shows all page traffic, in and out, during and around the startup of Clock.
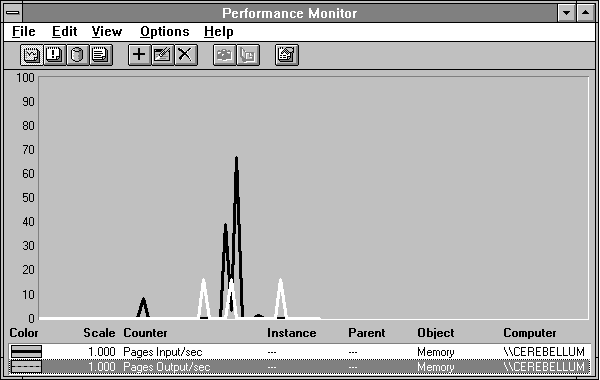
Figure 5.11 Both input and output page traffic during the startup of Clock
The input pages are the wide black line and the pages being written are the highlighted white line. It looks like some pages were written in response to our starting clock, right in the center of the figure. But it also looks like some were written both before our activity and after. What's going on? Pages that have been changed in RAM but are not yet updated on the peripheral they came from are called dirty pages. When changed pages are removed from a working set when there is not much memory pressure, the memory manager may not write those pages back to disk right away. Instead they are placed on a modified page list maintained by the memory manager. Periodically a thread in the System process, called the modified page writer, examines the modified page list and writes some of the pages out to free up the space. This strategy prevents excessive writing of pages that are removed from working sets, only to be quickly reclaimed by the process using them. As free space becomes scarce, the modified page thread is awakened more often.
We went through the working sets of all the processes in the system during this test. We found only one that had been trimmed during the test: the lmsvscs process. This process controls LAN Manager services such as the Workstation service, and is the agent for starting, stopping, and querying the status of such beasties. It has been idle on this system for quite some time, and the memory manager has removed a few pages from its working set just as we started logging activity. Clean pages went to the standby list, from which lmsvcs could retrieve them if they were needed. Those which are dirty go to the modified page list. When free page frames become scarce, pages on the standby list are cleared and added to the free list. If they are needed after that, they must come from the peripheral source. When the writing of a modified page is completed, the pagenow cleangoes onto the standby list.
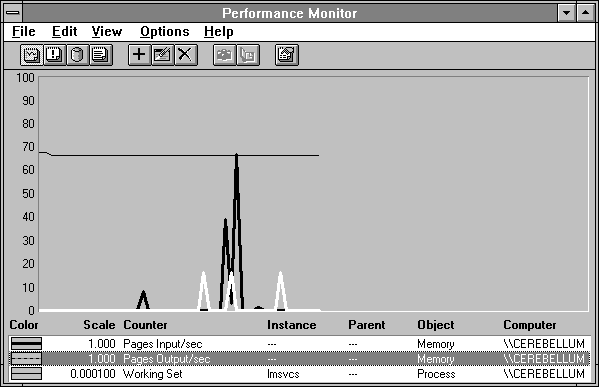
Figure 5.12 A working set is trimmed because it is inactive
To see all the page traffic in both directions, use the Memory: Pages/sec counter. This counter indicates the overall level of paging activity. It is important to watch both input and output pages, even though a page fault only results directly in page input. This is because a process could be flooding the system with dirty pages (which is what clearmem does to the extreme) and this can cause the memory manager to trim the working sets of lots of other processes.