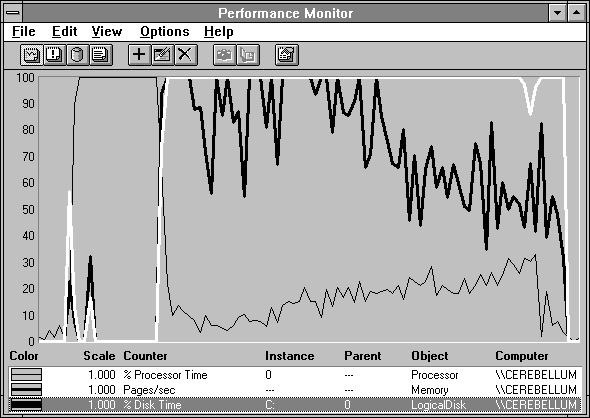
A memory hog is an application that either through self-indulgent design or sheer complexity of mission, absorbs large amounts of memory. Let's take a look at a memory hog application, in Figure 5.19. There is a little paging activity on the left (highlighted in white) and then the processor (thin black line) saturates for a bit, and then kablooey, the disk is pegged and Pages/sec goes crazy, while the processor is suppressed and only gradually regains some ground as paging subsides a bit.

Figure 5.19 Overview of memory hog activity
We know enough already to know that this system is memory bound. The sustained high paging rate is the only clue we need. But who's the culprit? Let's take a closer look.

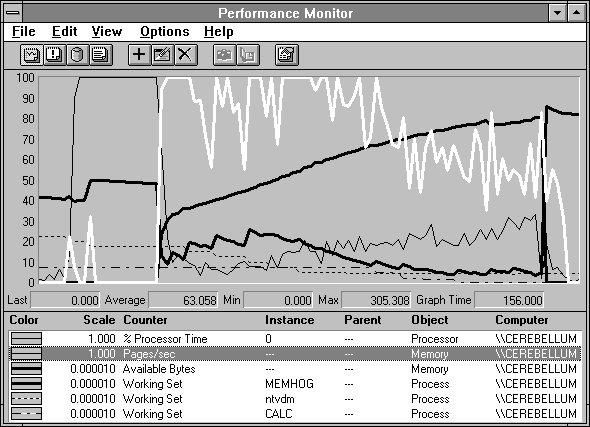
Figure 5.20 Memory hog innards exposed
On the left we see the processor utilization (thin black line) shoot up to the max during Response Probe calibration. There is some paging activity (highlighted) as Response Probe is first brought into memory. The NTVDM running Word for Windows loses a bit of its working set at this time as indicated by the black dotted line. During calibration there is some more paging activity as the memory manager seeks to get back to 4 MB of free space. The NTVDM loses a bit more, and presumably some other process not shown because we see a nice gain in Available Bytes (thick black line). Things are pretty quiet during calibration, but when the probe starts the MemHog process, life gets exciting.
Pages/sec goes wild, up to 305 as the value bar indicates. The rising thick black line of the MemHog working set creeps up across the display, destroying everything in its path. The working sets of NTVDM and Calc get trimmed, as well as those of other processes not shown. This causes some momentary increases in Available Bytes (the other thick black line), which are short lived as the counter eventually succumbs to memory demands and yields most of its gains to the MemHog. In the face of all this paging activity, the processor usage has dropped quite low. This is more typical of severe paging than the previous example, where some of the probe processes were able to make some processor headway in between page faults. This example illustrates the inability of the applications to use the processor in the face of the heavy disk demands imposed by excessive paging.
Calc has the working set indicated by the dashed black line. Notice that it is level until about halfway across the screen. Why? Because Calc was in the foreground before the test started. The memory manager favors the working set of the foreground process. Both Program Manager and, in particular, CSRSS get favored treatment also. The memory manager waits until things are quite desperate before trimming pages from the working sets of these favored processes. In this case, the memory manager is forced eventually to abandon this policy and give the memory used by the Calc working set to MemHog. Bummer. Now when you switch back to Calc, expect a delay and some disk rattling.
As MemHog builds up its working set, paging softens a bit and the processor utilization improves. But there is no real relief until the MemHog program ends. Then Available Bytes soars as all that memory is returned for other uses. What a relief!