First, let's see how the client and the server look when we have an isolated network with just the two computers connected. We want to use unbuffered reads from a file so we can bypass the cache on the client side. This will not bypass the cache on the server, however, so if we reread the same record over and over, we'll hit the cache on the server side every time. By increasing the record size we can get a pretty clear view of how much data a single client can pump across this isolated network. The server is a 66-MHz Intel Pentium with 32 MB of RAM, and a Novell NE3200 Ethernet controller on the motherboard. The client is a 486/33 with 16 MB of RAM and a Novell NE3200 network adapter. The media is thin cable Ethernet. We've selected the NetBEUI protocol for now.
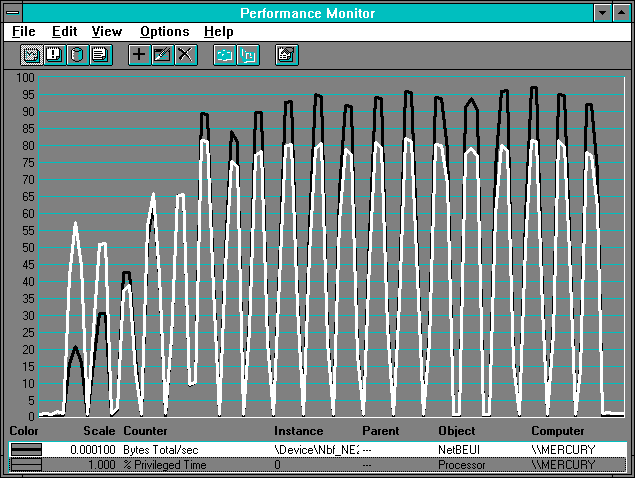
Since we are doing unbuffered reading, we must read in multiples of our disk sector size. We'll start with 512-, 1024-, 2048-, and 4096-byte reads, and then increase in 4096-byte increments up to 64K records. The resulting NetBEUI: Bytes Total/sec from the client's side is shown in Figure 7.1.
Figure 7.1 Client's view of a network throughput test
The throughput as measured by NetBEUI: Bytes Total/sec climbs as we increase the record size. (If we had multiple network cards installed, each would be an object instance and we would see a different such value for each card.) We have charted % Privileged Time, which we shall see accounts for nearly all the processor time. During application of the test cases, the processor usage rises to a plateau.
Before we take a closer look at what is going on here, let's see how the server fares.
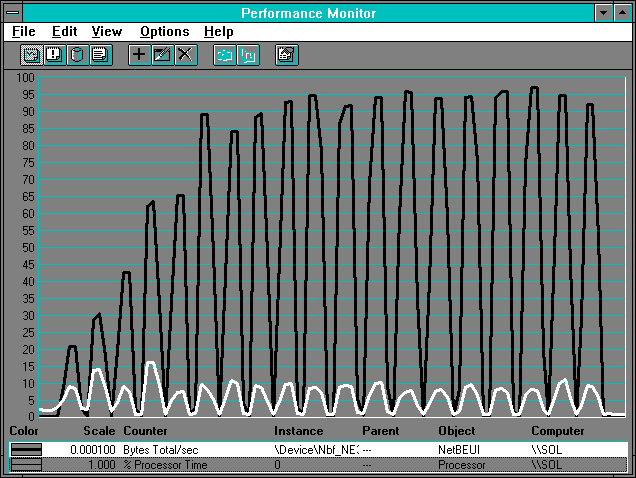
Figure 7.2 Server's view of a network throughput test
Notice the throughput matches the client side (it had better!), but the processor utilization is much lower on this side. Unlike on the client, the processor utilization on the server is pretty constant.
Let's begin by explaining what is in these throughput charts. The throughput rises in an almost linear way up to a record size of 4096 bytes. Then at 8192 bytes we get just little more throughput than at 4096 bytes. This is because the Redirector file system treats a request of 8192 bytes as two 4096-byte requests. Since we don't have to go back through the application program and the I/O system for the second 4096 bytes, we get only a very slight boost over the 4096-byte case. But with 3-page transfers we get a significant jump, because the protocol switches to what are called large reads. This is a more efficient protocol as long as the server has buffer space to handle the request, which is surely the case in this test. We'll look closely at a case of large reads later in this chapter.
First let's look at the 2048-byte transfer. We narrow the time window to focus in on the 2048-byte case. In the next two figures we present first the client's view of this activity, then the server's view.
Note For NetBEUI we are showing only the non-zero counters in these illustrations. This does not mean the other counters are not useful. In fact, knowing that the failure counters are zero removes an important potential bottleneck source from consideration. It just means these counters are not useful for the analysis of this rather sterile environment test case.
NetBEUI: Bytes Total/sec normally includes both frame-based activity and datagram activity. (When frames are sent across the network, they are expected to be acknowledged by the receiver, and are re-sent by the sender if not acknowledged, while datagrams are just sent with no expectation of an acknowledgment and no retransmission in case of failure.) Datagram counters can be a major indicator of activity. By knowing which applications use datagrams, you can get a clue about which ones are causing the majority of your network activity. Because no process is sending datagrams in our example, we omitted the datagram counters from Figure 7.3.
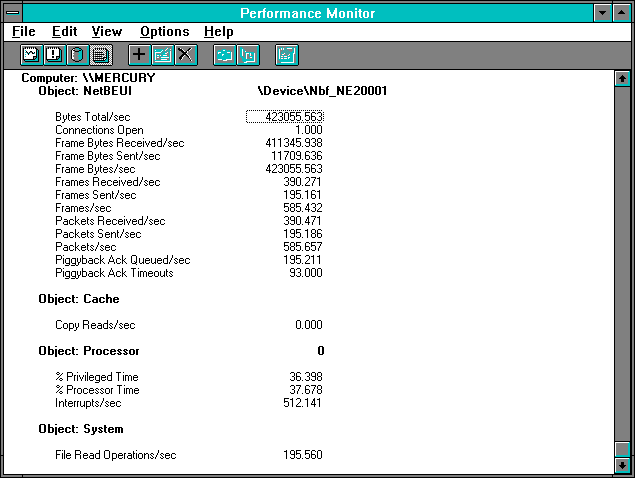
Figure 7.3 Client's view of unbuffered reading of 2048-byte records
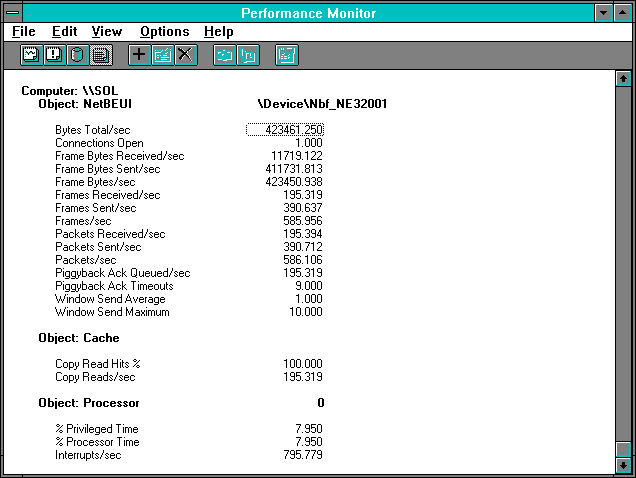
Figure 7.4 Server's view of unbuffered reading of 2048-byte records
NetBEUI: Bytes Total/sec is a key indicator of network throughput. This only includes bytes in data frames and not other bytes sent as part of the protocol, such as stand-alone acknowledgments (called ACKs). Bytes Total/sec includes both incoming and outgoing data frame bytes. As an average, it's a victim of Rule #10: it reveals basics while hiding details.
Since the Response Probe does not use the cache on the client side, the System: File Read Operations/sec value gives us a clear indication of the file read activity. This is nearly identical to the Frames Received/sec. Dividing Frame Bytes Sent/sec by the Frames Received/sec we get 59.9999; perhaps we can take a risk and invoke Rule #9 and call that 60. This is the basic minimal data frame for NetBEUI. This frame holds the entire request for our data. Similarly, dividing Frame Bytes Received/sec by Frames Received/sec we get 2107.7, which is 2047.7 + 60, or within Rule #9 of our requested record size of 2048 plus the basic frame size.
There is one packet sent for each frame sent, but there are two packets received for each read request (390.471/195.560 = 1.9967). That's because Ethernet has a maximum packet size of 1514, so it takes two packets to send the 2108 bytes back.
Average packet size received is Frame Bytes Received/sec divided by Packets Received/sec, or 1053.46, or about half of the 2108 as we might expect for an average. We can also see that we are not hitting the cache on the client at all, which is good, because that is what we want to do in this experiment. We are using 37.678% of the client processor to do all this, and have a pretty healthy interrupt rate (the at-rest interrupt rate on this system with Performance Monitor running at five-second intervals is 114 interrupts per second). We'll get back to the issue of interrupts in a moment. It turns out to be a key point.
Let's take a look at the server. The server side is a close mirror of the client side. We did not collect both systems' data into one log file because we did not want to add to the network traffic during this test, so the two time windows do not coincide precisely. (Even if we had, exact synchronization of Performance Monitor data from two computers is not possible, as we noted in Chapter 2.) Nonetheless, we see pretty good agreement between the client and the server, as we expect in such a steady-state test. The server is hitting the cache on every read request. It is getting just a few more interrupts but has significantly lower processor utilization.
The next two figures show how the redirector and the server software see this activity. On the client side we divide the Redirector: Bytes Received/sec by Redirector: Packets Received/sec and get 2108, which must be the 2048 bytes we are requesting plus the 60-byte basic frame. The redirector considers the whole request and the whole reply as a single "packet." This is obviously not a packet in the NetBEUI sense. Keep this in mind when looking at these statistics.
The redirector is also not a separate process. Very nearly all the % Processor Time spent in processes is accounted for by the Ideagen process, which is the name of our probe application process reading the records. The redirector is just a file system invoked by the I/O manager inside the address space of Ideagen. Yet there is a large gap between the Processor: % Processor Time and the Process: % Processor Time of Ideagen. We'll have to come back to this, but let's take a look at the server software's view first.
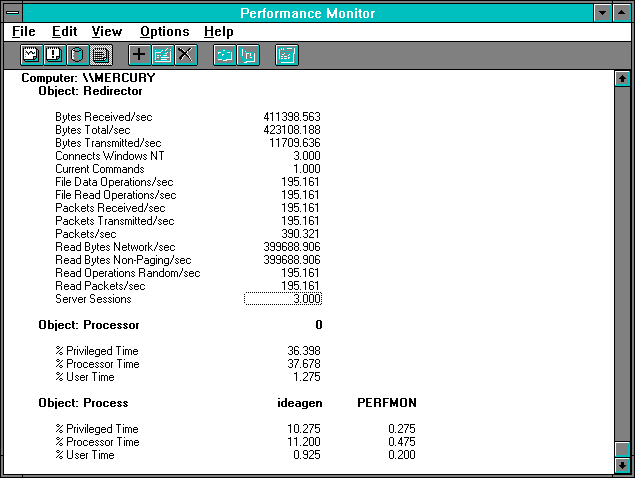
Figure 7.5 Redirector's view of reading 2048 bytes
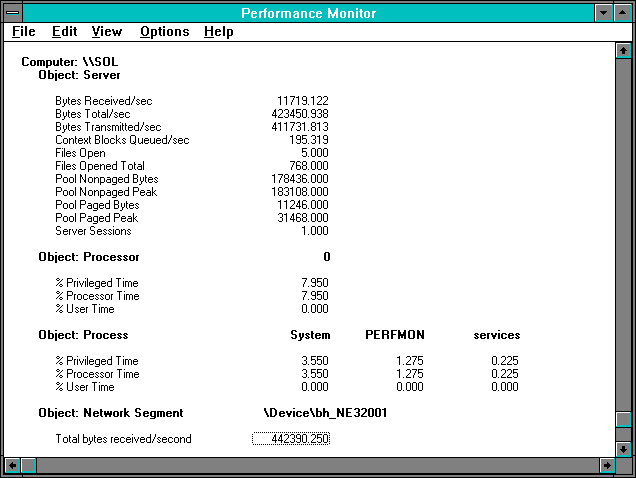
Figure 7.6 Server's view of reading 2048 bytes
The server's side of things holds no surprises. As we noted in an earlier chapter, the server process has the name System. Dividing the Bytes Transmitted/sec by the Context Blocks Queued/sec gives the number 2108. By now, this is a familiar number. The Processor: % Processor Time is over 50% higher than that of the server process, so we see a gap similar to the one we saw on the redirector side.
The Network Segment object measures all traffic on the segment of the network attached to the indicated adapter, independent of which system sends or receives it. This object can be monitored from any computer on the segment. The Network Segment Object measures the effects of all packets. Network Segment: Total Bytes/sec is a bit higher than Server: or NetBEUI:Total Bytes/sec, because ACK (acknowledgment) packets are included.