Let's take a step back for a moment. We see a big difference in the processor usage on the client and the processor usage on the server. This is reflected in overall processor usage as well as in such details as the calculated time in the interrupt handler. There are two fundamentally separate sources for this difference, and we should try to separate them. One is that the client and the server are not doing exactly the same work. The other is that they have different hardware: one computer has an Intel Pentium, and the other is an Intel i486™.
One way to get a handle on how these separate factors influence what we are seeing is to reverse their roles. Windows NT is pleasantly flexible in this regard. We can make the i486 computer be the server and the Pentium computer be the client with a couple of mouse clicks in File Manager.
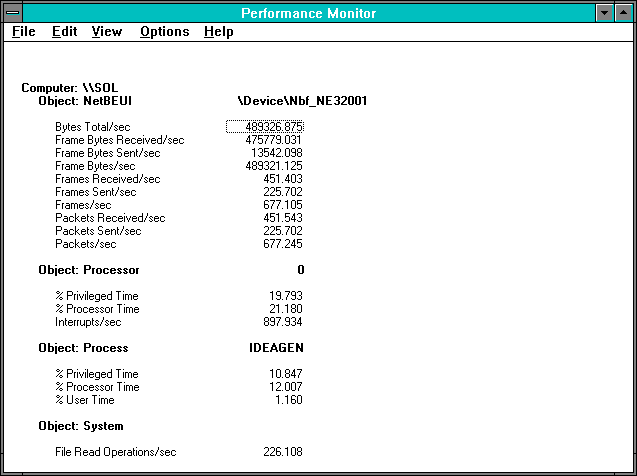
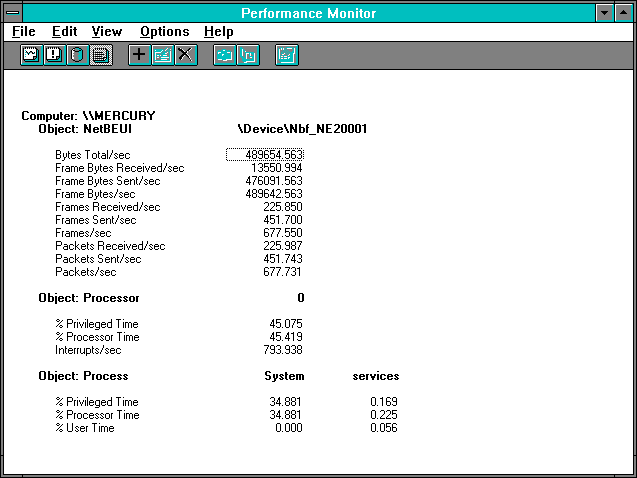
The next figure shows the client side of the 2048-byte read case when the client is the Pentium computer. It is followed by the server's view of the same case with the server being the i486 computer.

Figure 7.11 Pentium client statistics for 2048-byte reads
Looking at NetBEUI: Bytes Total/sec, we see an increase of about 70K per second. Sure, you say, because the bottleneck was the client processor and we replaced it with a faster one. But we also violated Rule #1 because we changed the server at the same time. To some extent, we just got lucky with this guess, as we shall see.
What we wanted to do was distinguish between the change in the roles of client and server and the different processor types. How can we do this? When the Pentium computer was the server, we saw that it handled 195.560 reads per second using 7.950% of the processor, which gave 460.5 microseconds per read. Now that it's the client, we are doing 226.108 reads using 21.180% of the processor, or 936.7 microseconds per read. We have two times the number of processor cycles being used on the client side of the transaction. Clearly it is more expensive for the Pentium to be a client than to be a server. Let's double-check this on the other side of the fence.

Figure 7.12 Server statistics when the server is an i486/33
On the i486 it looks like the situation is reversed. Unlike the Pentium there has been an increase in processor usage as we switched from client to server. But we need to invoke Rule #7 and look at the counter ratios before leaping to a conclusion. As we switch from client to server on the i486, the processor utilization has increased from 37.678% to 45.419%, but the number of reads per second has also increased. The server per read processor time is 2009microseconds. The client per read processor time is 1927. Unlike the Pentium, it is almost the same being a client or a server on the i486. .
What can we say about the relative behavior of the two processors?
The Pentium is 2 times faster at doing the client work because it uses 0.9367 milliseconds per read, versus 1.927 on the 486/33. And the Pentium is over 4 times faster at doing this simple server work than the i486/33 (0.4605 milliseconds versus 2.009 milliseconds for the I486/33). It appears that the Pentium is better at both workloads, but is much better at handling the server workload. Since the Pentium is running at twice the clock rate of the i486, we might expect it to be about twice as fast, all other things being equal. We might conjecture that the larger cache of the Pentium accommodates this simple server test case more easily than it can handle the client workload.
This leads to an important lesson that is well illustrated here. Relative processor performanceor relative computer hardware performance in general is extremely sensitive to the workload applied. Here we are using a simple synthetic workload, so generalizing it to a real application workload would be improper. Once you get your own applications running on these servers, you can compare the processors in the way we have here. At that point other important mitigating factors like disk subsystem performance will enable you to get a realistic picture of relative platform performance. What we've tried to do here is make sure that when you get to that point, you'll know precisely how to proceed.
And finally, where is the bottleneck now? Well, the media time hasn't changed; it is still taking 1.734 milliseconds per read plus adapter time. We have shifted the bottleneck over to the server, or left it on the i486/33, depending on how you want to look at it.