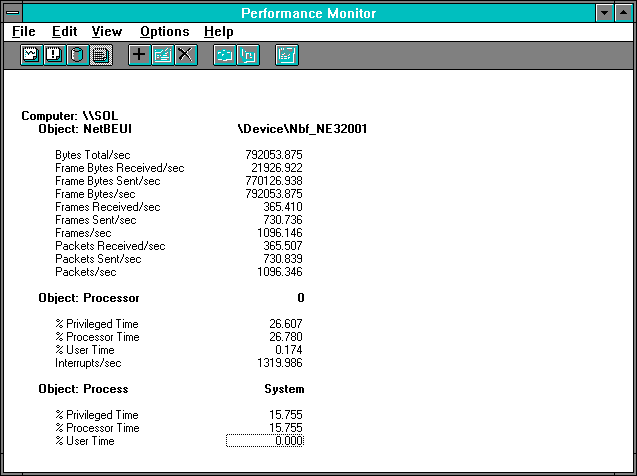
Let's have several clients simultaneously access our server to test its mettle. We'll revert to the 2048-byte transfer case, since it seems a bit more realistic for normal network traffic than the 14-page transfer. But it's not entirely realistic, because all the clients will simultaneously try to copy the same record from the server, over and over, without causing any server disk activity or doing any processing on the client side. So we'll be hammering the server in an unrealistic manner, but we'll see how the additional clients affect overall performance. We'll add two, three, four, and then five clients, each doing the above unbuffered read over NetBEUI on the Ethernet network.

Figure 7.13 Two clients on a server, NetBEUI view from the server's perspective
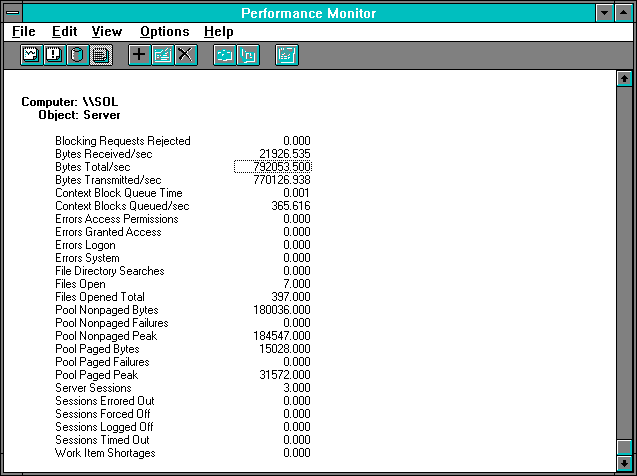
Figure 7.14 Two clients on a server, Server statistics
Let's look first at the two-client case. What we see is nearly double the throughput of the single client case. Boy, how we love these controlled experiments! Actually, both number of reads as counted by Frames Received/sec and Total Bytes/sec have increased by about 87%. Interrupts have only increased by 66%, however, so the server is handling more work on each interrupt. The interesting thing is that the processor usage is up over a factor of three from the single-client case from 7.950% to 26.780%. Most of this increase is in the System process's processor usage, which rose from 3.55% to 15.755%, so having multiple concurrent clients must complicate System's life quite a bit.
Let's take a closer look at this. System process processor time has gone from 182 microseconds per read to 431. This is a 137% increase. Interrupt time was calculated above as 64 microseconds per interrupt in the single client case, and since there were just over four interrupts per read this was 260 microseconds per read. In this 2-client test case it is 84 microseconds/interrupt, and with 3.61 interrupts per read, this gives us 303 microseconds of interrupt time per read. So while System process tie is up 137% from the single client case, interrupt time is up only 17%. Between these two sources of delay, there are 292 new microseconds in the server on each request. The single client response time is 1 / 195.550 = 0.00511 seconds per read, while for each of the two clients we get 1 / 364.41 / 2 = 0.00547 for a difference of 360 microseconds. So we conclude the other 68 microseconds of delay must be in the line and the server adapter card. Clearly most of the new delay is in the server processor.
Let's add another client.
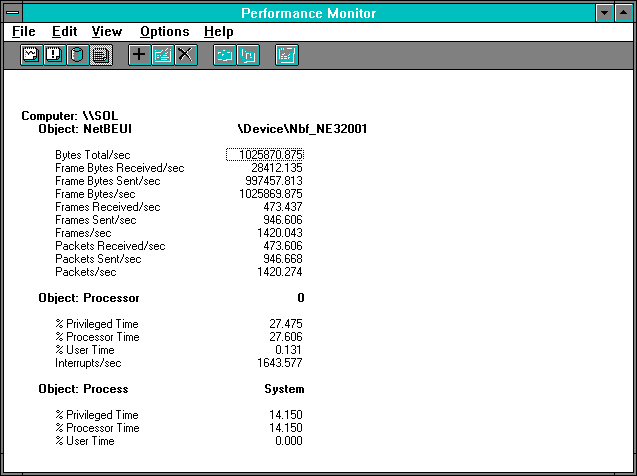
Figure 7.15 Three clients pile on, NetBEUI statistics on the server
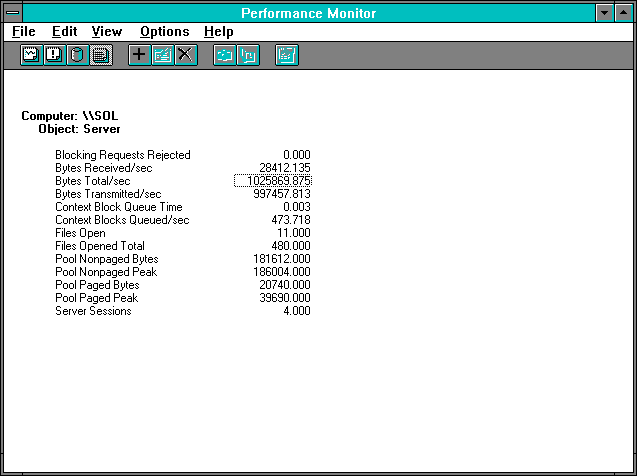
Figure 7.16 Three clients pile on, Server statistics
We already see something interesting with just three clients. Note that the NetBEUI: Bytes Total/sec is not three times the individual client transfer rate of 423461.250 we saw in the single-client case. As an increment over the 2-client case it is only about 20%. Also, the increase in processor usage is actually rather modest. Yet we have three clients each getting 1/3 of the 473.437 requests/sec, or 157.812 each, for 0.00634 seconds per read. That's an additional 867 microseconds of delay per request. There must be some new source of conflict. Where is it?
Let's look first at the server's processor usage. The processor itself is now 27.606% busy handling the server work. This is quite a bit more than we had in the single-client case, but only a shade more than we had in the 2-client case, and is furthermore unlikely to be the bottleneck. Why? Because the more concurrency we have, the less sequencing we have, and the utilization of the bottlenecking device should be closer to 100%. And we now have 27.606 % processor usage handling 473.437 requests per second, giving 583 microseconds of processor per request. That's noticeably less than the 734 microseconds per request we saw in the 2-client case, indicating that an economy of scale is building up: we must be getting more work done on a thread dispatch or a DPC call as concurrency increases, since more work is pending in our queues.
Now let's take a look at four clients.
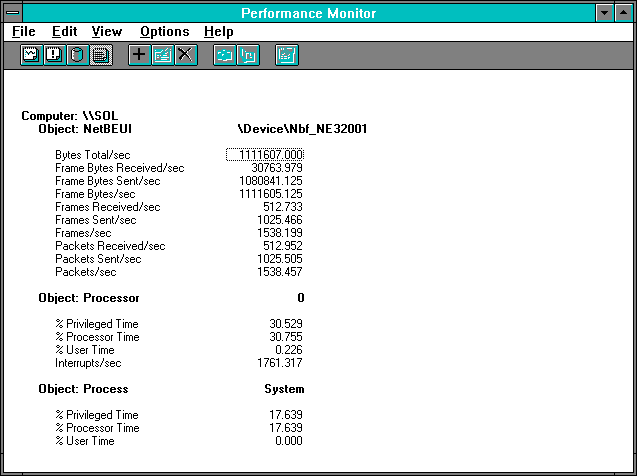
Figure 7.17 Four clients pile on, NetBEUI statistics on the server
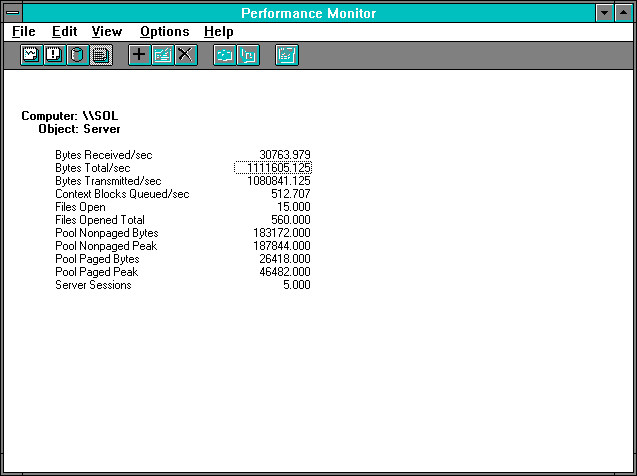
Figure 7.18 Four clients pile on, Server statistics
The total byte throughput is up somewhat, although certainly not by another 423461 bytes per second, which is what our new client would like to be doing. The % Processor Time is within a Rule #9 of being unchanged from the 3-client case, and the interrupt rate has not increased much either. We have not been able to add a lot of work to this mix, even though we have added more clients. Dividing the Frames Received/sec by 4 clients, and then inverting, we see each request is taking 0.007801 seconds, or 1.48 milliseconds more than in the 3-client case. Delays are increasing, but we don't see much more work being done inside the server. By now it should be dawning on us that the queue might be forming outside the server.
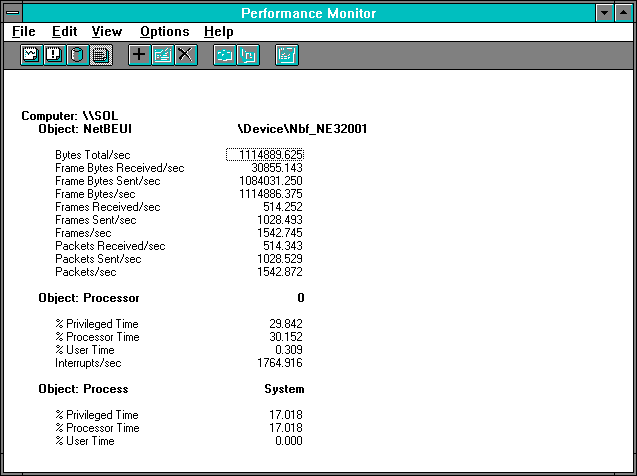
Figure 7.19 Five clients pile on, NetBEUI statistics on the server
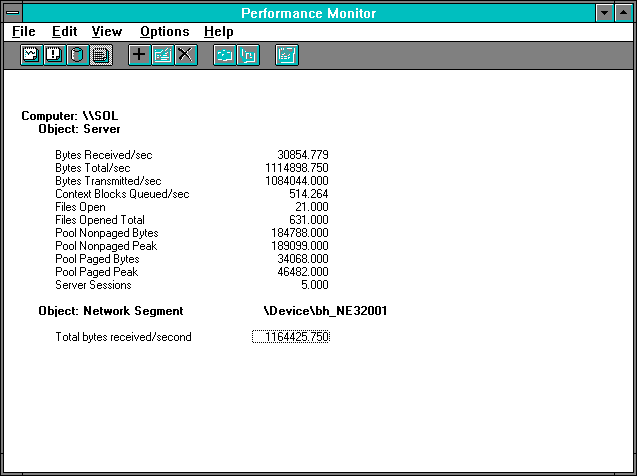
Figure 7.20 Five clients pile on, Server statistics
Now we see a very slight increase in byte throughput. The % Processor Time and the interrupt rate are essentially unchanged, and more importantly the Frames Received/sec are also unchanged. Since this request rate is now divided between 5 clients, we observe that 1 / (514.252 /5) = 0.009723 tells us that each request is now taking 9.72 milliseconds, or 1.93 milliseconds more than each 4-client request. Notice how each additional delay is escalating at a rate greater than the linear rate of increase in number of clients, as we illustrated in our discussion of Rule #8. Have you figured out the truth yet?
What is happening here is we have saturated the network media. How can that be, you say? We are not yet transmitting 1.25 million bytes/second, which is the capacity of an Ethernet network. Well, we are pretty darn close. There are two reasons why we are not reaching the theoretical maximum.