First, let's take a look at a few ways to monitor multiple servers. This is a common need for keeping records of performance on computer networks. (In "Monitoring Desktop Computers," later in this chapter, we'll discuss what you should do differently when you monitor workstations.)
It's usually easier to log the servers' performance data. If you don't log, you have to be pretty quick on the print screen key. If you're not using the Performance Monitoring service, you can log from multiple servers into a single log file. How many servers? That depends on how much data you collect from each one and how often you collect it.
Typically, you'll be doing bottleneck detection on your servers on a daily basis anyway. It's actually quite easy to take the information you're gathering for bottleneck detection and use it later for capacity planning.
Let's talk about what data you want to collect from your servers for bottleneck detection. At first, you might want to log just the following objects: Processor, System, Memory, Cache, Logical Disk, and the protocol at the adapter card level if possible. You'll want to log the Network Segment object from one server on each segment. This is quite economical, and it is very easy to see exactly how much disk space this costs you. Switch Performance Monitor to Log view, set up to log these objects, and set logging to manual update mode. Then click the camera icon a few times. Note the file size. Click again. Note the new size. The difference is the cost of logging this data on that system. On a typical system, this is under 7K. If you have 10 such systems you have 70K, and if you have 100 systems, you have 700K (ouch).
Now, how often should you collect data? Let's suppose we have 25 servers so we are collecting 175K with each snapshot of the data, and that we collect data every minute. At the end of an eight-hour shift we'll have about 84 MB of data. As long as you reduce the data as described below so you don't have to save this much after each day's activity, it might not be considered prohibitive. But we aren't the ones buying the disks, so you might want to collect a little bit less. If you know how much disk space you can use for this each day, you can use the procedures we've just outlined to determine which objects to monitor, and at what time interval.
If you have an application server, you might want to collect some additional objects such as processes or even threads (so you can see the critical System: Processor Queue Length counter). The application itself might provide some extended object counters for Performance Monitor. If so, these might be worth keeping an eye on.
Another way to watch lots of systems is to use the Alert view. We've said little about alerts so far in this book, but nothing handles the monitoring of lots of systems (without taking up lots of disk space) quite as well. And your own creativity is the limit. That's because, as we mention in Chapter 2, you can use Microsoft Test or a similar product to change Performance Monitor's settings in response to an alert. You can reduce the time interval, add objects, and start or stop logging, all in response to alerts.
You can have the alert messages sent to you anywhere on the network just by adding a special name to the system you are using. For example, typing net name wizard /add adds the name "wizard" to the system you are on. If you then direct the alert to send a message to "wizard," it will find you no matter where you areeven out on a RAS client laptop somewhere over the South Pole.
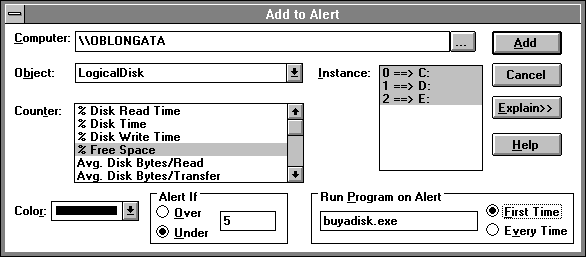
One thing you will surely want to do is set an alert on the % Free Space on your file server logical drives. You do not have to enable DISKPERF.SYS to see the free space on your logical drives, but you already have DISKPERF.SYS enabled on all your servers because you ran some experiments after reading the previous chapters (right?), so this is not an issue. The next figure shows how you can set an alert on several drives at once. After setting this alert, we will get an alert as soon as the free space on any of the logical disk drives falls below five percent.

Figure 8.1 Setting alerts on disk free space for multiple drives