Usually you can tell you have a performance problem because someone is beating down your door complaining about it. (And that someone may well be yourself.) What to do then?
Your first reaction should always be to run Performance Monitor. The objective of Performance Monitor is not to solve all performance problems, but rather to make sure no one wastes any time barking up the wrong tree. The Windows NT SDK provides a number of tools you can use to tune your application, and running Performance Monitor before tuning helps you make sure you pick up the right tools to use next.
Let's take an example from the early days of the development of Windows NT. We ported the Solitaire program to Windows NT from 16-bit Windows. Initial users of the game complained about its performance when the cards cascade at the end of a winning game. You've never seen this because you've never beaten Solitaire? Well, on Windows NT we have built this in as a graphics demo. To see it, start Solitaire from the Games group and press SHIFT+ALT+2. That's the number 2, not the F2 key. We hope you're not disappointed with the speed, because the tuning work we are about to demonstrate has already been done on the copy of Solitaire you are running.
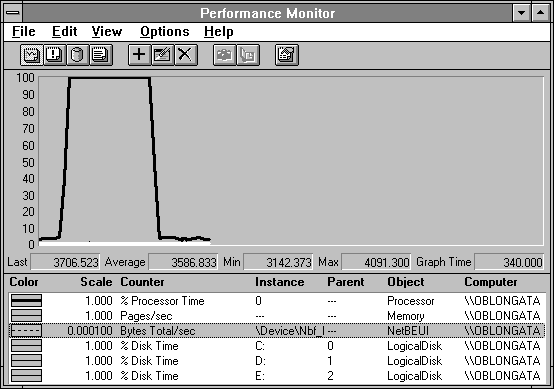
When we heard complaints about Solitaire, our first step was to run Performance Monitor. Because we didn't think Solitaire used the network, we logged the data across the LAN so we didn't interfere with any possible disk activity. We set the time interval to five seconds because the operation we wanted to time takes about 90 seconds. This gave us only 18 data points, which we figured was probably enough. If it wasn't, we could have built a version of Solitaire that performs the cascade operation repeatedly. You can't get too far exploring application performance problems unless you can isolate the problem.

Figure 10.1 Overview of the Solitaire cascade
The overview from our log file of Solitaire is plotted in Figure 10.1. It's pretty clear that we have a processor bottleneck. All the other chart lines are flat, except for the LAN activity generated by Performance Monitor. How can we be sure this activity is caused by Performance Monitor? The average NetBEUI: Bytes Total/sec (3587) times the length of the run in seconds (340) is just about the size of the Performance Monitor log file (1120260 bytes; we learned this from the dir command).

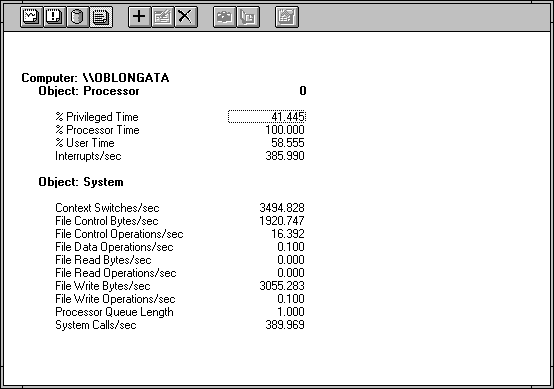
Figure 10.2 Processor and system statistics during the Solitaire cascade
We're spending 41.445% of the time in privileged mode, and we see a pretty high context switch rate for this computer, a 486/33. Because the value of File Write Bytes/sec is close to the NetBEUI: Bytes Total/sec we saw in Figure 10.1, we can tell that the File Write Bytes/sec rate was caused by the redirector when it wrote Performance Monitor data. The interrupt rate is consistent with a system connected to a busy network, but not too active on it. We followed our own advice from Chapter 3, and looked at which processes were eating up the processor.

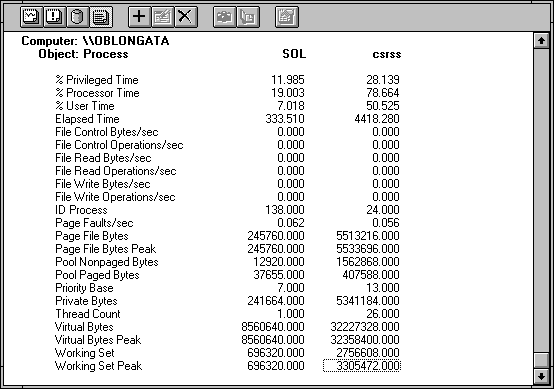
Figure 10.3 Process activity during the Solitaire cascade
Looks like CSRSS was doing all the work. Between Sol and CSRSS, the processor was maxed out. We decided to see if looking at the threads could give us any more information about what was going on here.

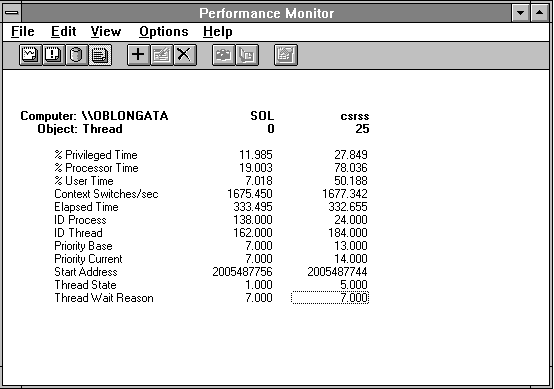
Figure 10.4 Thread statistics during the Solitaire cascade
Now we can see where all those context switches were going. Solitaire is calling CSRSS constantly, and most of the time is spent in CSRSS in a single thread. (For clarity, we omitted the 25 idle or near-idle CSRSS threads from the report shown here.)
We're not spending a great deal of time in the Solitaire program. So it must be Windows NT that has the problem, right? Let's make sure that's true by using the next indicated tool, the Windows API Profiler.