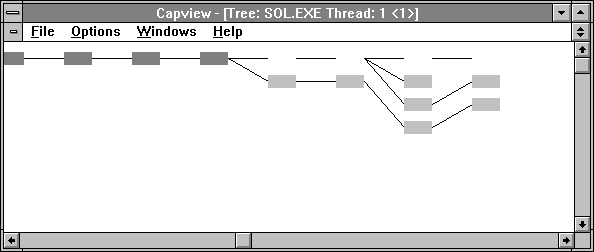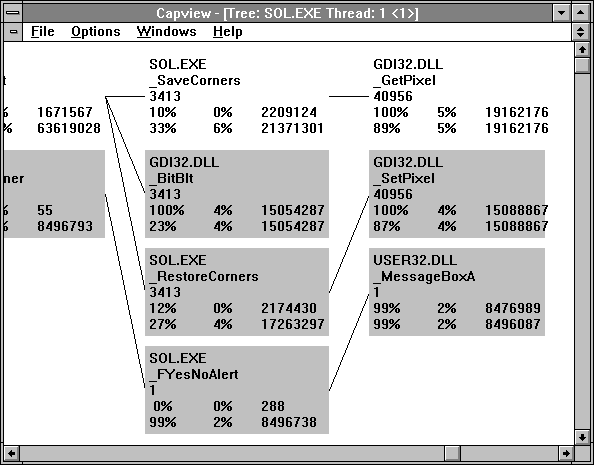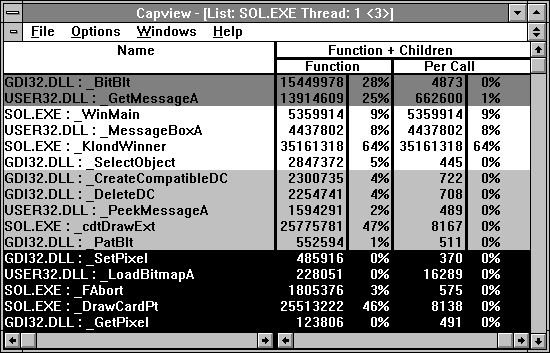
Looking at Figures 10.7 and 10.8 is educational but a mite tedious if you have a large program with hundreds or thousands of functions. There is a great alternative: Capview. Figures 10.9 through 10.11 show some of the data from running the repaired Solitaire as it is seen by Capview.

Figure 10.9 Capview tree profile of Solitaire cascade, zoomed out

Figure 10.10 Capview tree profile of Solitaire cascade, zoomed in
Each box in the Capview tree represents a line in the SOL.CAP file. If you zoom out you get the overview, and if you zoom in you can see the details of each line.
The first figure in the box is the number of calls made to that routine.
The rightmost number in the next line of figures is the time spent in the function itself, expressed in microseconds. The left number is the attributed time. This is the time spent in the function expressed as a percentage of the time in the function plus the time in the functions it calls. The middle figure is time in the function as a percentage of time in the entire program.
In the last line, the rightmost number is the attributed time. The middle number is the attributed time in this function as a percentage of time in the program. And the leftmost number is the time in this function as a percentage of attributed time in the calling function.

Figure 10.11 Capview list profile of Solitaire cascade
The List view of Capview is illustrated in Figure 10.11. The attributed columns are shown but the function-only columns are also available.