We've all had those discouraging moments when summary statistics of API calls just won't solve our problems. We've got the solution for those darned old API summation blues. Just install the Windows NT 32-bit API logger and you can look at every single API call and the parameters that are passed to it. There's hardly a better way to spend a summer afternoon.
The Win32 API Logger comes on the Windows NT SDK but is not automatically installed by the SDK setup. You'll find it in \MSTOOLS\BIN\LOGGER32.
Currently, the API Logger works only on Intel processors, and there is no logger DLL for CRTDLL.DLL. The WAP and logging measurement DLLs have the same names, so be sure not to get them mixed up.
Like FIOSAP, the Win32 API Logger is an outgrowth of the WAP technology. You use the same program, apf32cvt, to install the API profiler. The API logger also has the identical measurement DLL names for ZSER32.DLL, ZERNEL.DLL, and so on. But apf32dmp has no role to play here. The logger just spews out data about API calls as soon as your application starts. It can chew up disk space faster than Performance Monitor. So, API logging noticeably slows down the application.
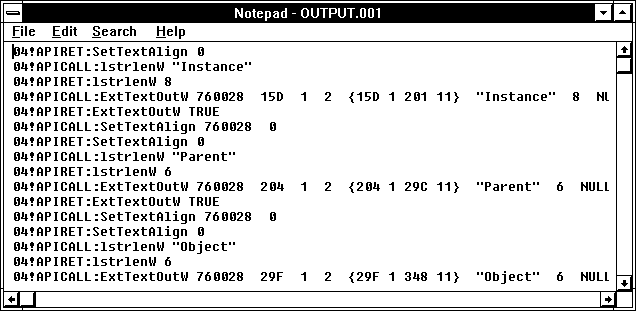
The API Logger writes a line for every API call and every return. It logs this information to two files: OUTPUT.LOG and OUTPUT.DAT. These go into the working directory of the application. OUTPUT.LOG is an ASCII file with the log of the API calls, the parameters to each call, and the return values. If a parameter is a pointer to a structure defined in the API, the structure will be output, enclosed in braces. OUTPUT.DAT is a binary file containing any parameters that are more than 128 characters long. In this case, the parameter in OUTPUT.LOG is "DATAFILE offset" where offset is the parameter's offset into OUTPUT.DAT.
The next figure shows a fragment of an API log file of Performance Monitor drawing a chart legend.

Figure 10.18 Log of API calls made by Performance Monitor when drawing a chart legend