You may want to get a better understanding of the pieces inside the working set of your application. For example, you may save a lot of code space with the Working Set Tuner only to discover that the code space is only a small portion of your overall working set. In fact, this might even be something you want to do before you go to all the trouble to tune your code space. Aren't you glad you read this far?
We put this section here at the end anyway because you have to fuss around a bit to do the next set of measurements. You probably want to do these on a test computer, one you don't use for production activity. Choose a computer large enough to hold your entire working-set tuning test scenario in memory. (You may need to discover this size through the trial and error process we describe in this section.)
The tool we use for this is called Virtual Address Dump, or vadump. The vadump tool looks inside the working set of a process and determines the nature of each page.
The first thing to do is to link your application using the -debug and -debugtype:coff flags, so that you get the full use out of vadump.
Start your application, then start PView, which you will find on the floppy disk provided with this book. Use PView to note the Process ID of your application. You'll need to supply this to vadump. You should convert the Process ID from hexadecimal to decimal, since vadump expects it in decimal format. (You can use the Scientific View of the Windows Calculator accessory to perform this conversion, if you like.) Or you can use the tlist utility to get the Process ID directly in decimal form.
Get your application to the point just prior to the scenario whose working set you want to measure. Start Performance Monitor and leave it running, and get a command window set up so you can run vadump. Type the following in the command window, but don't press ENTER yet.
vadump -o -m -p PID >app.vad
Here -o tells vadump to monitor the working set in the original style, -m tells vadump to use the mapped symbols, and -p indicates the next number (PID) is the decimal Process ID of the process to measure. In our example command line the output is directed to the file APP.VAD.
But you haven't pressed enter yet, right?
In another window, set up clearmem, a utility that flushes everything from memory and the disk cache. (It is provided on the floppy disk you got with this book.) It will drive your application out of memory.
To be sure this happens, use Performance Monitor to chart the working set of your application. Also chart your application's Page Faults/sec.
Now switch to clearmem. Run it repeatedly (while keeping an eye on Performance Monitor) until your application has no pages in memory. Running clearmem once or twice typically does the trick. If your application is the type that wakes up periodically to do some housekeeping chores, it will always have some pages in memory. In this case, run clearmem a few times until Performance Monitor shows your application has reached as low a working set as it will attain.
Now switch to your application and execute the test scenario you devised earlier in this chapter for working set tuning.
Use Performance Monitor to note the size of your application's working set. Do this by selecting the Working Set line in the legend and reading the Last value.
Now switch to the vadump window and execute the vadump command set up above by pressing the Enter key. The results will be put in APP.VAD if you use the command line we showed above.
Take a look at Performance Monitor again and get the new size for your application's working set. This is likely to be a bit larger now than before, because vadump itself must bring some pages into the working set in order to scan all the page tables and working set entries for your application.
Run the scenario in your application again. Performance Monitor should get no page faults in your application during this run. If it does, you may not have enough memory on the system to hold your application's working set (we know, it's hard to believe, isn't it?) Add physical memory to the computer and try again.
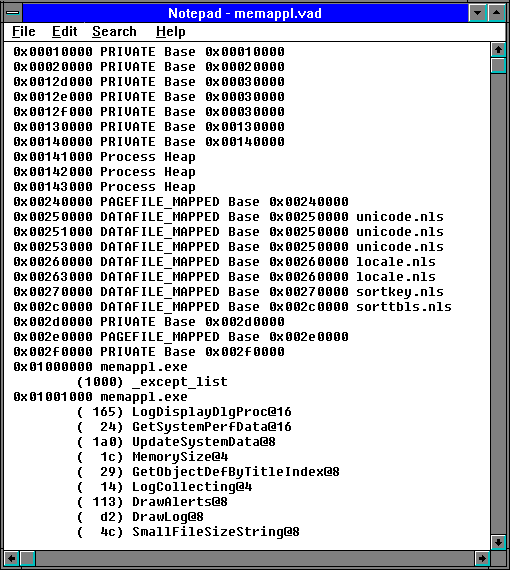
The output from vadump shows the nature of each page in the working set of your process. See Figure 11.1. The System pages are those allocated for the page tables and for the working set list itself. As indicated above, this might be larger than your application actually needs because vadump needs to scan them. So use Performance Monitor as described to determine the difference. For the example in Figure 11.1, where we looked at the working set of Performance Monitor while charting, running vadump added 5 pages to the working set. Your mileage may vary.

Figure 11.1 Partial vadump results of Performance Monitor charting
The page virtual addresses appear on the left. For each section of address space, the base is shown on the right. PRIVATE pages are dynamic data pages that are private to the process. Process Heap pages are dynamically allocated from the process heap. It can be difficult to determine who is using this space, and you may need to look at pointers within your application using the debugger to be sure.
If coff symbols are included and the module was linked with the =debug flag, other pages that belong to specific modules are indicated by listing which public symbols occur within the page. This helps you to understand why a particular page has been brought into memory. If the module was compiled without the correct flags you will just see the module name.
Any pages listed as belonging to the module "Error" are pages that did not resolve to a particular module. Frankly, we don't know to whom these belong. When you find out, please let us know.
You will also find some DATA pages at the upper end of the application's address space. These are for such system-related items as the Process Environment Block, the Thread Environment Blocks, the Per-Thread Data Area, and so on and so forth.
Pages in the range starting at 0xC0000000 are page table pages. They are listed showing the range of pages they map, how many of those are in memory (these are called resident pages), and the range of resident pages and their modules.
Finally, there is a summary of pages and who owns them. These just summarize the pages already listed, so take care not to count them again.
Remember that all the code pages in your working set may be shared with other processes, and will appear in their working sets as well, even though a shared code page takes up only one page frame in RAM.