Detecting the source of a performance problem isn't always a straightforward task. Sometimes it requires that you try different tools, running each in several ways, examining computer performance, and repeating the tests in a rigorous, scientific manner.
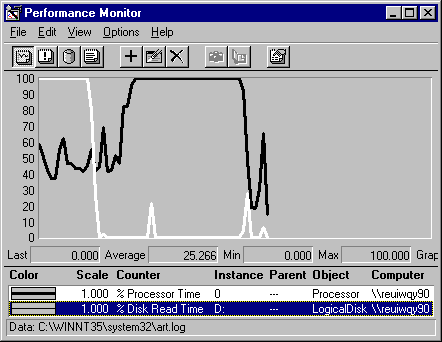
Problems can appear intermittently or be camouflaged by some greater or lesser matter. The following graph is an example of what you might see.

This is a Performance Monitor graph of processor and disk use over a 61-second interval. The white line represents disk activity; the black line represents processor activity. If you viewed just the first half of the interval, you would conclude that you have a disk bottleneck; the second half might lead you to believe you have a processor bottleneck. When the data is logged over time, you find that the processor is actually the problemóbut you'd never know it from a one-minute glance.
This part of the Windows NT 4.0 Workstation Resource Guide is designed to help you tune and optimize Windows NT 4.0 Workstation. The remainder of the chapter includes some history and important information about Windows NT Workstation that affect how you monitor it.
The Resource Guide and Other Resources
The following materials might be of interest as well: