The Time Window lets you view selected portions of data from your log. When you change the Time Window interval, Performance Monitor recalculates all values, including minimum, maximum, and average values to match the selected time interval. The Time Window command on the Edit menu is activated when you are working with data from a log. It is available in all four views and the time selected applies to all views.
The Time Window is essential to viewing computers, processes, and threads that are started when the log is already in progress. When you graph data from a log, only those objects active when the log starts are visible. To see data on objects started later, you must advance the Time Window to a time when the object was active. After you select counters for the object, you can re-expand the Time Window to see the whole log.
The Time Window interface simplifies the process. When you click Time Window on the Edit menu, the Input Log File Timeframe dialog box appears. Unfortunately, it appears right on top of your graph. Move it to the side so you can see both the graph and the dialog box.
When you move the left and right slider tabs on the slider bar, gray vertical lines appear on the graph to show you which part of the data occurred at that time. You can click and drag the slider tabs with your mouse or use the arrow keys for more precise control.
The arrow keys work like this:
¬ | Moves begin time bar ¬ |
Shift + ¬ | Moves end time bar ¬ |
® | Moves end time bar ® |
Shift ® | Moves begin time bar ® |
After you have the slider tabs set to a certain time interval, for example, one minute, you can click the space between the tabs and drag the one-minute interval across the graph.
Among its other functions, the Time Window lets you
This section explains how to use the Time Window for precise control of Performance Monitor logs.
Charts and reports of log files are limited to 100 data points. If more data points are collected, the data is compressed to 100 points. For example, if 1000 data points are collected, Performance Monitor displays every 10th point. This loss of precision is most important when you are charting instantaneous counters.
You can narrow the Time Window to make all data points for that portion of the data visible, and then view the remainder of the data separately or in another copy of Performance Monitor.
Tip
Set the slider bar tabs to 100 data points, then click the space on the slider bar between the tabs and drag the 100-point interval to surround the parts of the graph you want to examine in more detail.
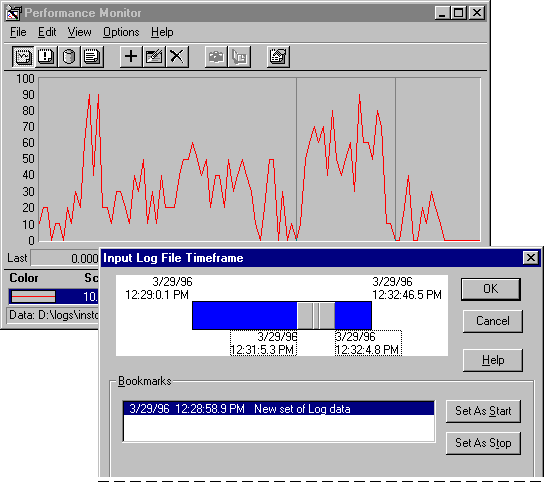
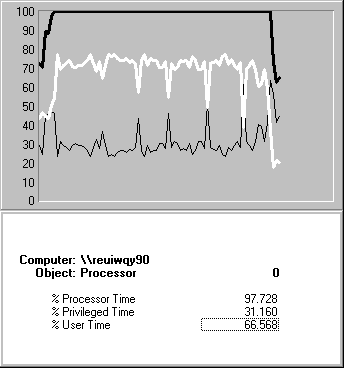
The following figure shows the Time Window being adjusted on a chart of the instantaneous counter System: Processor Queue Length. More than 100 data points were recorded, so the data is compressed. The Time Window lines bracket the one section of the curve.
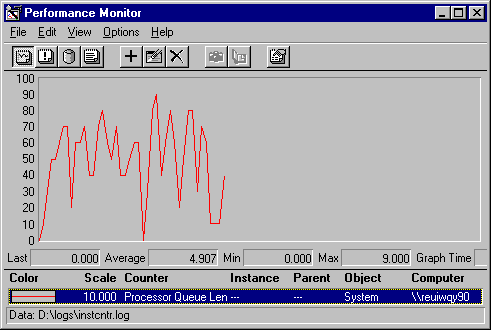
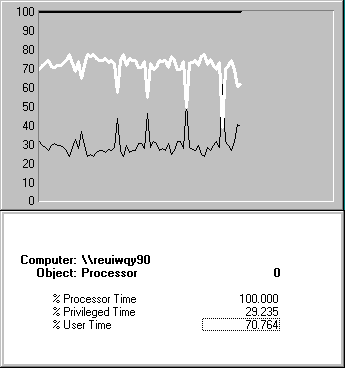
The following figure shows the graph that results when you narrow the Time Window to just a portion of the data. Here all of the data points in this part of the curve are visible, revealing more detail.
Only active objects appear in the Instances box of Performance Monitor counters. In logged data, objects that weren't active when the log started do not appear in the Instances box until the Time Window is adjusted. In order for the object to appear as an instance, you must adjust the Time Window interval to start after the object is started. After you have selected counters for the instance, you can expand the Time Window to show the whole log, and the instance remains monitored.
Note
When monitoring threads that start and stop as the process proceeds, it is important to use the Time Window to search through the data for thread starts. Do not assume that all threads are apparent at the start of the process. After you have set at least one counter for each thread, you can expand the Time Window to show all of them.
For example, when you chart data from a log that includes the start of an process, the process does not appear in the Instances box if the Time Window interval begins before the process starts, even if the Time Window interval includes the start. When you adjust the Time Window interval to begin when the process is active, you can monitor it.
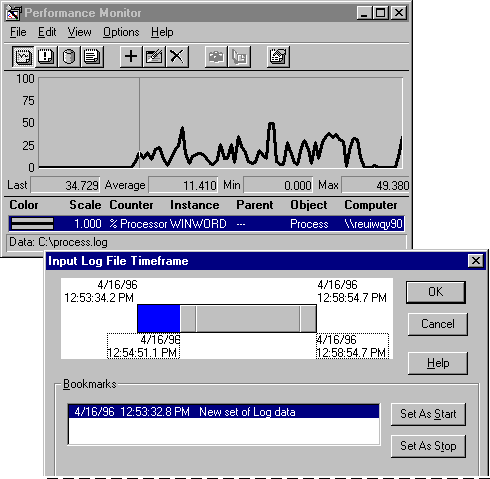
In this figure, the Time Window is adjusted to begin after the process starts so additional counters can be added. After the new counters are added, the Time Window can be expanded again.
You can use the Time Window to eliminate invalid or unwanted data from a sample. Simply set the Time Window interval to include only the data you want in your sample. All Performance Monitor statistics are recalculated to include only the data within the Time Window interval, including the data shown in averages, reports, and histograms.
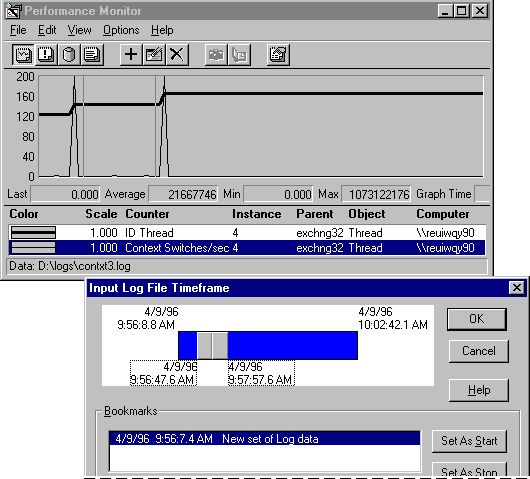
In this example, data is being limited to an interval during which a single thread is active. The resulting graph, below, shows that the data spikes that skewed the previous averages are eliminated.
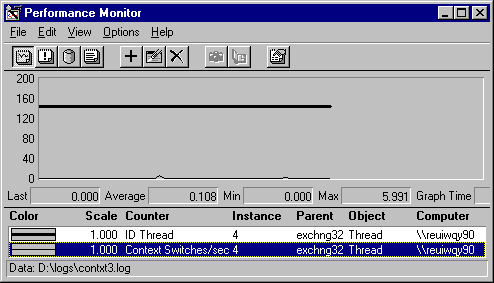
The Time Window lets you limit your reports to the most significant parts of the event. For example, when reporting on averages, it's vital to exclude startup and shutdown values which might skew the averages.
The following combined graph and report represent data logged before, during, and after a test. Notice the values shown in the report and then compare them to the values shown in the report section of the next figure.
The following graph and report of the same event is limited to the test period. It was created by setting the Time Window to exclude the period before and after the test.
The preceding figures were created by using two copies of Performance Monitor reading data from the same logfile. (To open a second copy of Performance Monitor, just double-click the Performance Monitor icon again.)
The Time Window helps to assure that the two copies are reporting on the same data. Arrange the windows on the screen so that they don't overlap. Click the Time Window menu option on each, then move the slider bars so that both copies reflect the same input data. Use the arrow keys for more precise control of the slider bar.
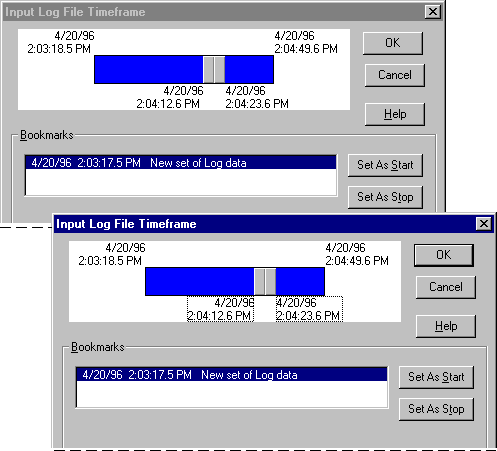
This figure shows the Input Log file Timeframe dialogs of two copies of Performance Monitor being coordinated.
Use the Time Window and other features of Performance Monitor to get the views you need and the precision you demand.