There are many useful tools for measuring physical and virtual memory and memory use. Most provide current totals and peak values of memory counts for processes and threads from the time they were started.
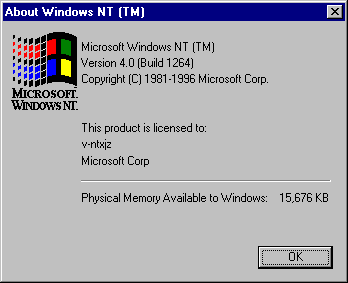
To see how much physical memory is available to Windows NT 4.0 Workstation, start Windows Explorer, and choose About Windows NT from the Help menu. Physical memory available to Windows is listed at the bottom.
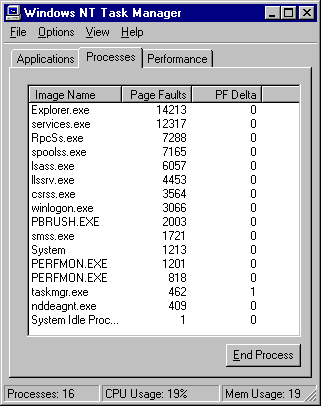
The Performance tab of Task Manager has a total physical memory field, memory usage counts, and a virtual memory graph. The Processes tab lists all processes running on the computer. From it, you can select columns to show Page Faultsa running total of page faults for the process since its startand Page Faults Delta (PF Delta)the change in page-fault totals between updates. Click the Page Faults or PF Delta column heading to sort processes by total page faults or by changes in page faults. The following figure shows the Task Manager Processes tab displaying the page-fault columns.
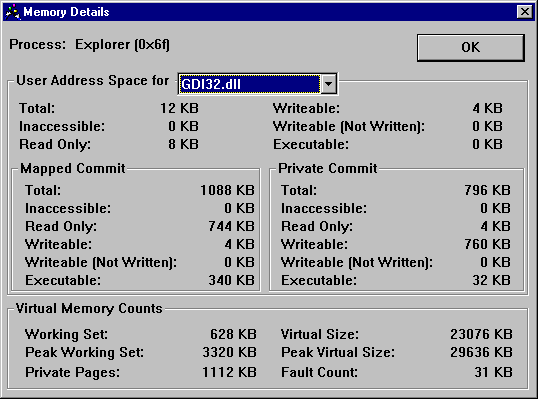
Process Explode (Pview.exe) and Process Viewer (Pviewer.exe) show accurate and detailed current memory counts without any setup. Process Explode shows it all on one screen. In Process Viewer, click Memory Detail to see the counts for each segment of the process's address space.
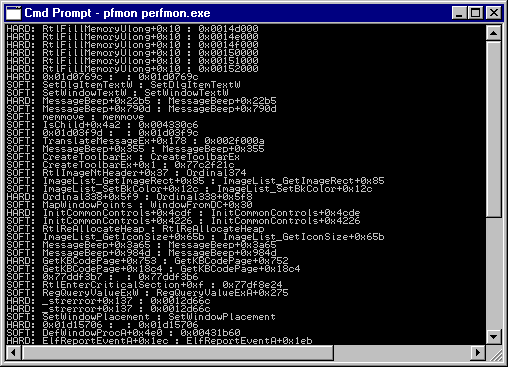
Page Fault Monitor (Pfmon.exe), a tool on the Windows NT Resource Kit 4.0 CD in the Performance Tools group (\Perftool\Meastool), produces a running list of hard and soft page faults generated by each function call in a running application. You can display the data, write it to a log file, or both.
You must run Page Fault Monitor from the command prompt window. Type pfmon /? to see a list of available switches. For more information, see Rktools.hlp.
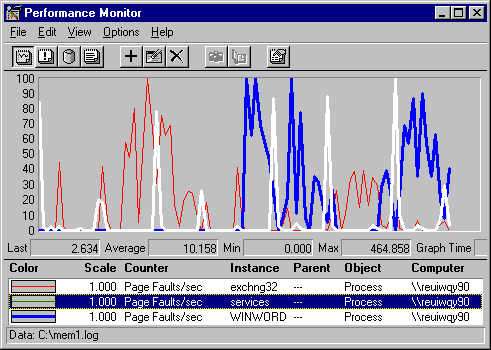
Performance Monitor logs data over time and displays it in line graphs. This is, by far, the best presentation of data related to memory use. Page faults, page reads, and disk operations aren't smooth, continuous increases; they are quick spikes in the data. Any totals or averaging hides the patterns.
The following figure is a Performance Monitor graph of Process: Page Faults/sec for several processes during their startup, when paging is high. The graph shows an increased page fault rate first for one application (the thin, gray line) and, later, for the other (the thick, black line). The white line represents page faults for the Services process which are interspersed throughout the sample interval.
The following report shows the same data presented in a report of average values over the measured time.
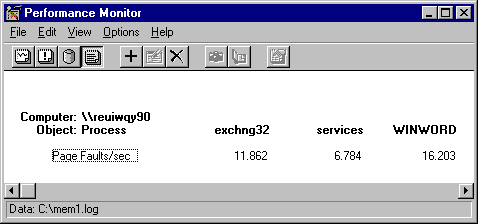
Although both provide useful information, the report does not reveal the patterns evident in the graph.
In addition to the monitoring tools, some simulation tools help you test the capacity of your memory. Clearmem, a utility on the Windows NT Resource Kit 4.0 CD, lets you measure the minimum working set for a process. It allocates all available memory, references it so it doesn't get paged out, then releases it. This forces the Virtual Memory Manager to trim the working sets of other processes to a minimum so that you can see how many pages your process is actually touching.