The first step in investigating a memory problem is to measure paging. Although soft page faults (in which pages not in the process's working set are found elsewhere in physical memory) interrupt the processor, their effect is likely to be negligible.
If you suspect a memory shortage, chart the following Performance Monitor counters:
These counters indicate how often processes must look beyond their working sets to find the code or data they need. They also indicate how often these requests require paging from disk and how many pages are moved with each disk transfer.
Note
The graphs for this section were produced on a 33-MHz 486 computer with only 10-12 MB of memory available to Windows NT 4.0 Workstation. Applications used in these examples will not cause memory bottlenecks when run with the recommended minimum of 16 MB of memory.
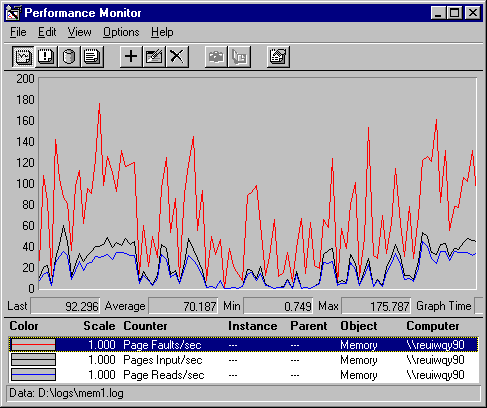
Compare the lines for Page Faults/sec and Pages Input/sec to determine the proportion of hard page faults (Pages input/sec) to all page faults (Page faults/sec). Both counters are measured in number of pages per second, so you can compare them without conversions. The lines intersect when the Virtual Memory Manager is reading from disk to satisfy a page fault. Space between the lines indicate soft page faults, which indicate that the missing page was found elsewhere in memory.
Pages input/sec is the number of pages read to satisfy a page fault, and Page Reads is the number of reads required to retrieve those pages. When the lines meet, the Virtual Memory Manager is moving one page per read operation. The space between the lines indicates that the Virtual Memory Manager is reading more than one page per operation. (You can calculate the amount of space by dividing Pages Input/sec by Page Reads/sec to find the number of pages per read operation. Space between the lines corresponds to a value greater than 1.)

In this example, the total page fault rate, Page Faults/sec (the top line), averages 70 per second. Page faults can interrupt the processor, but only hard faults slow the system down significantly. The next line, Pages Input/sec, measures hard faults in the numbers of pages retrieved to satisfy the fault. In this example, the rate is 21.5 pages per second on average. Although hard faults represent only 31% of all pages faulted (21.5/70), 21.5 pages per second can produce enough disk activity to cause produce a disk bottleneck.
The area between the top two lines represents soft faults; that is, pages found elsewhere in memory, either in the file system cache, in transition to disk, in the working set of another process, or brought in from memory as zeros. In this case, there are many; approximately 69% of page faults are soft faults.
The bottom line, partially superimposed upon Pages Input/sec, is Page Reads/sec, the number of times the disk is read to satisfy a page fault. This is an important indicator of the type of paging that causes system bottlenecks. The average of 16 reads/sec is quite high. Although the line representing Pages Input/sec and Page Reads/sec are close to each other, at times they diverge, indicating multiple pages read during each read operation. On average, 21.5 pages/sec are read in 16 page reads/sec. This shows that the Virtual Memory Manager is reading about 1.3 pages during each read operation.
In this example, 69% of the pages faulted because they were not in the working set of the monitored process, were found elsewhere in memory, probably in the file system cache. Because it is much quicker to retrieve data from the cache than from disk, Windows NT uses all available physical memory as cache. However, the remaining 31% of faulted pages caused in average of 16 reads/sec from disk; enough to cause a disk bottleneck. The next step is to associate paging with disk use.