Use the same testing methods to compare the performance of different disks. Disk components vary in architecture and design philosophy, and they use different protocols. As expected, performance varies widely and is usually correlated with the price of the components. Most workstations will perform adequately with the most moderately priced disk components. However, if you have a disk bottleneck, you might want to evaluate different disk components.
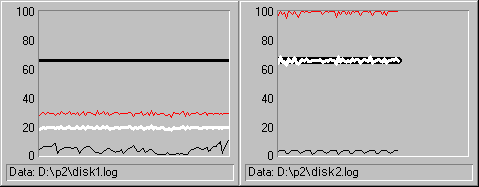
The following figure compares the reading performance of two very different disk configurations side by side. As you might expect, the graph on the right represents the more expensive disk. That disk uses direct memory access (DMA), a method of transferring data to disk that minimizes the use of the processor. The graph on the left represents the performance of a more traditional disk design which uses programmed I/O, a disk transfer method that uses the processor to determine which disk sectors are read.
The disks were both reading 64K records from a 40 MB file on an otherwise idle computer. Performance Monitor was writing its log to a different physical drive.

In both graphs, the heavy black line is Avg. Disk Bytes/Read, the gray line is Disk Read Bytes/sec, the white line is Disk Reads/sec, and the thin, black line near the bottom is Avg. Disk sec/Read. Because the lines don't curve much, they can be shrunk to show them side by side without losing too much detail.
In summary, the gray and white lines, representing Disk Read Bytes/sec and Disk Reads/sec, respectively, are much lower in the first graph than in the second. On the same task and the same computer, throughput on the disk that is represented by the graph on the right is 3.4 times higher than throughput on the disk represented by the graph on the left.
Because the lines are nearly straight, the averages shown in the following comparative reports are likely to represent disk performance accurately.

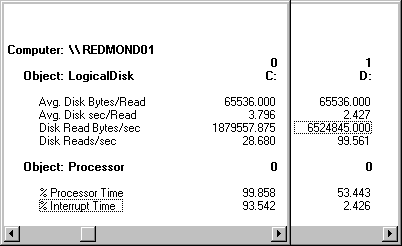
To produce a report like this one, superimpose two copies of Performance Monitor reports on the same counters for different disks. (You can also export the data to a spreadsheet, but this method is quicker.)
The reports are evidence of significant performance differences between the disks. In this example, Drive C uses programmed I/O; Drive D uses DMA. While reading from the C drive, the processor was nearly 100% busy, but because it was reading only 28.7 times per second, the throughput was just 1.88 MB/sec. When the same test was run on the D drive, the processor was only 53% busy, and it was reading nearly 100 times per second, for a total throughput of 6.5 MB/sec.
The difference in the strategies is revealed in the % Interrupt Time, which was 93.5% on the C drive and only 2% on the D drive. The C drive configuration uses the processor for disk access. The processor is interrupted between each 512-byte sector read. This amounts to 128 interrupts for each 65536-byte record read. The C drive is reading an average of 187955.875 bytes/sec, so the processor is being interrupted 3671 times each second. That is enough to consume all processor time.
In contrast, the more advanced D drive configuration interrupts the processor five times to set up the read operation, but doesn't issue any further interrupts for the remainder of the read. This strategy obviously benefits even more from larger records, whereas the C drive strategy produces ever more interrupts as the record size grows.
This test is just an example of the kinds of tests you can use to compare disk configurations. A complete test would use the same methods to test reading, writing, reading and writing randomly and sequentially, and reading and writing records of different sizes. A vital test, one to measure maximum throughput on your disk, is explained in the following section.