Applications that use the cache effectively are hurt most during a cache shortage. A relatively small cache, under 5 MB in a system with 16 MB of physical memory, is likely to become a bottleneck for the applications that use it.
However, normal rates of reads, hits, and flushes vary widely with the nature of the application and how it is structured. Thus, you must establish cache-use benchmarks for each application. Only then can you determine the effect of a cache bottleneck on the application.
To monitor the effect of a cache bottleneck on an application, log the Cache and Memory objects over time, then chart the following counters:
Tip
To test your application with different size caches, add the MAXMEM parameter in the Boot.ini file. This lets you change the amount of memory available to Windows NT without affecting the physical memory in your computer.
A cache bottleneck appears in an application as a steady decrease in Copy Read Hits while Copy Reads/sec are relatively stable. There are no recommended levels for these counters, but running an application over time in an otherwise idle system with ample memory will demonstrate normal rates for the application. It will also let you compare how effectively different applications use the cache. When you run the same applications on a system where memory is scarce, you will see this rate drop if the cache is a bottleneck. In general, a hit rate of over 80% is considered to be excellent. A 10% decrease in normal hit rates is cause for concern and probably indicates a memory shortage.
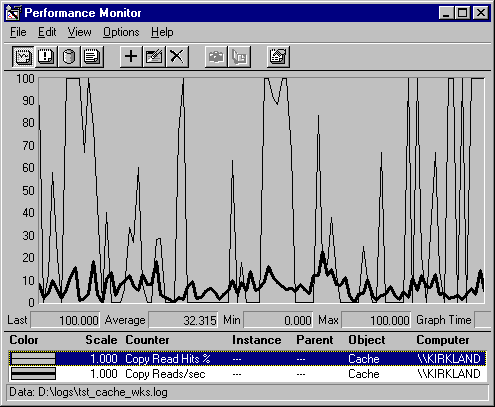
The following graph shows a comparison of copy reads and copy hits for several instances of a compiler. Compilers are relatively efficient users of the cache because their data (application code) is often read and processed sequentially. During the short time-interval represented here, the cache size varied from 6.3 MB to 7.3 MB.

In this example, the thicker line is Copy Reads/sec and the thin line is Copy Read Hits %. The Copy Reads/sec, averaging 6 per second, are a moderate amount, and the Copy Read Hits %, at an average of 32%, are also moderate. This indicates that, on average, fewer than 2 reads/sec are satisfied by data found in the cache. The remainder are counted as page faults and sought elsewhere in memory or on disk.
It is important to put some of these rates in perspective. When copy reads are low (around 5 per second), a 90% average hit rate means that the data for 4.5 reads was found in the cache. However, when reads are at 50 per second, a 40% hit rate means that data for 20 reads was found in the cache.
Accumulating data like this while varying the amount of memory will help you determine the effect of cache size on your application.