Performance Monitor samplesrather than timesthreads. Sampling uses far fewer resources, especially on Intel 486 and earlier processors which have a software timer on a separate chip. Consequently, processor time, process time, and thread time counters might underestimate or overestimate activity on your system.
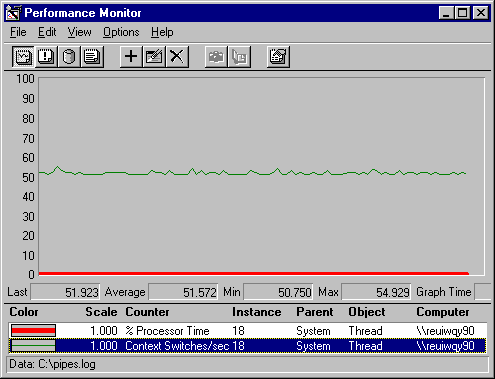
The following graph demonstrates this sampling error.

In this example, the context switch rate reveals that the processor is being switched from running the System 18 thread to running other threads about 50 times each second. However, the thread's total processor time (the thick line at the bottom) appears to be 0. This contradictory data results from sampling error: the thread ran so briefly between context switches that Performance Monitor missed it.
This sampling error is most evident on processessuch as Performance Monitorthat are launched by the processor interrupt. TotlProc, a utility on Windows NT Resource Kit 4.0 CD, installs an extensible Performance Monitor counter designed to measure processor time on interrupt-launched applications more accurately. TotlProc is in the Performance Tools group in \PerfTool\TotlProc. For more details, see Rktools.hlp.
Warning TotlProc is not compatible with the processor time counters on other tools. While TotlProc is running, Performance Monitor and Task Manager processor time counters always display 100%.