The Thread object also has a %Processor Time counter. It is most useful after you have determined that one or two processes are accounting for most of a processor's time.
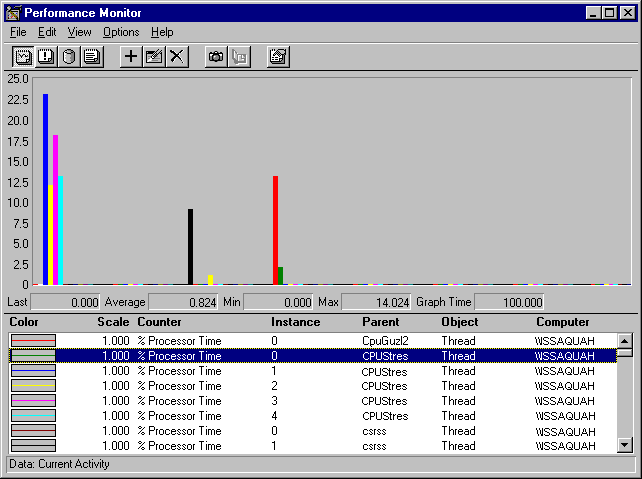
The following figure is a histogram of Thread: % Processor Time for all threads running during the bottleneck.

Each bar of the histogram represents the processor time of a single thread. Threads are identified by process name and thread number and, in this graph, the threads of each process are listed in sequence. (The order in which the threads appear on the graph depends on the order in which you add them to your chart.) The thread number represents the order in which the threads started, and it can change even as the thread runs.
This graph shows that the four threads of the five threads of the CPU Stress process (at the far left) are dominating the pattern of processor use, although a few other threads are getting some processor time.
If your graphs look like these, you might consider adding another processor. A bottleneck caused by one or more multithreaded applications is a prime candidate for a multiprocessor computer. Instead, you might choose to replace the application that is consuming the processor time, or measure, tune, and rewrite it. The next sections assumes you have taken the latter path and demonstrates a more detailed investigation of thread behavior.