The first step in diagnosing a disk bottleneck is distinguishing it from a memory bottleneck. Sustained paging, a symptom of a memory shortage, can look like a disk bottleneck.
Pagingmoving pages of code and data between memory and diskis a necessary part of the virtual memory system. Paging is expected, especially when the system or a process is starting. However, excessive paging that consumes the disk is a symptom of a memory shortage. The solution is to add memory, not disks.
To measure paging, chart the following counters:
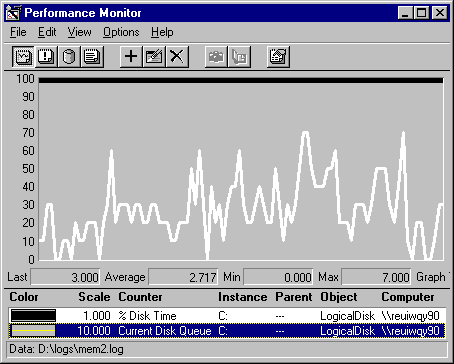
The following graph shows an apparent, if transient, disk bottleneck.

In this example, the thick black stripe on the top is % Disk Time, at a sustained rate of 100%. The white line is Current Disk Queue Length, an instantaneous count of the items in the disk queue. There are up to 7 items in the queue to disk in this sample, and the average is nearly 3. It looks like a faster disk is needed.
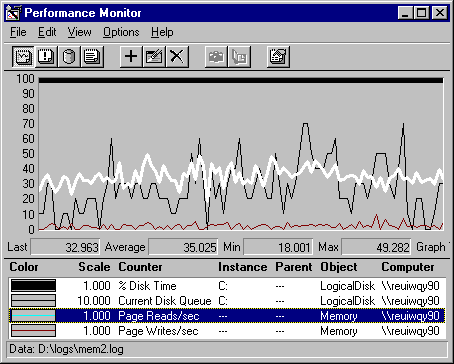
However, the following graph reveals at least one element contributing to the queue.

This graph is the same as the previous one, except for the addition of Memory: Page Reads/sec (the white line) and Memory: Page Writes/sec (the thin line at the bottom of the graph). Current Disk Queue is now the thin, black line behind Page Reads/sec. The memory counters show how many times the disk was accessed to retrieve pages that were not found in memory or to write pages to free up memory for new data coming in from disk.
The average of 37 disk accesses per secondincluding 35 Page Reads/sec (as shown in the value bar) and nearly 2 Page Writes/secis probably the maximum for this older technology disk.
If this pattern persists beyond the startup of the system or a process, you have a memory bottleneck, not a disk bottleneck. However, before you add memory, make sure that the memory bottleneck is not caused by an inefficient application. For more information, see Chapter 12, "Detecting Memory Bottlenecks."