
| Microsoft Office 2000/Visual Basic Programmer's Guide | |
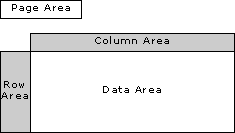
A PivotTable report consists of four areas where you can display fields: the row area, column area, data area, and page area. Figure 15.2 shows each of these areas, and the following sections describe them.
Figure 15.2 Four Areas of a PivotTable Report
The row and column areas usually display the fields that are most critical for your query. For example, if you want the PivotTable report to answer the question, "Which countries generated the most sales for the first quarters of 1996, 1997, and 1998?", the PivotTable report needs to display both a list of countries and the data for the first quarter of each of those years. Because you want to display data by country for the first quarter, add the Country field to the row area, add the Year field to the column area, and add the Quarter field to the column area to the right of the Year field.
Whether you put a given field in the row area or in the column area is up to you; the resulting data in the PivotTable report will be the same. However, it makes sense to arrange individual fields within an area hierarchically, so that you can group data in the way that's easiest to read. For example, if you're adding a Country field and a City field, add the Country field first, then add the City field to the right of it, so that data is grouped first by country, then by cities within those countries.
Figure 15.3 points out the row and column fields in a PivotTable report. As you can see, the Country field is in the first position in the row area, and the City field is in the second position. This way, the data is grouped first by country, then by city.
Figure 15.3 PivotTable Report Showing Sales Data for All Products, by City, for Selected Countries, for Multiple Years
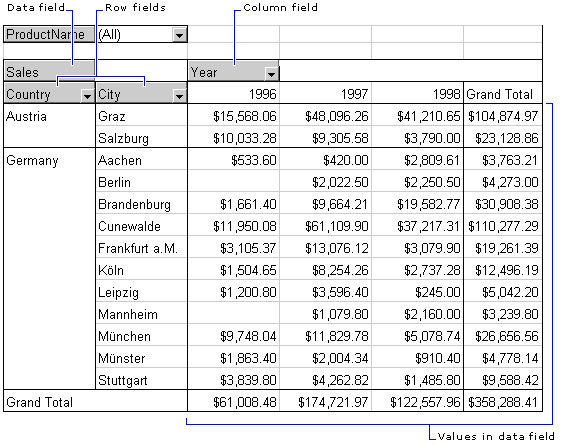
The data area displays the data that you want to analyze with the PivotTable report; it answers the questions that you ask about the data. You can think of the data in a cell in the data area of a PivotTable report as the intersection between values in the row and column fields. For example, the data in one cell in Figure 15.3 shows that sales in Salzburg, Austria for 1996 were $10,033.28.
The name of the data field appears in the upper left corner of the PivotTable report, as shown in Figure 15.3. By default the field name includes the aggregate function that is being performed on the data — for example, "Sum of Sales" — but you can name the PivotTable field whatever you want.
As mentioned previously, the data area must contain numeric data. However, you can perform additional calculations on this data, to find the sum, average, and so on. You can also create a calculated field to perform calculations on data. For example, you can multiply the Quantity and UnitPrice fields together to display the total value for a group of orders in the PivotTable report. You can also use calculated fields to perform projections on the data. For example, you can create a calculated field to answer the question, "How will profits be affected if sales in Germany increase by 10% for the upcoming year?"
Although you must add fields to the row, column, and data areas of a PivotTable report, adding fields to the page area is optional. Page fields can add an additional level to your data analysis. For example, suppose you've laid out the PivotTable report to display quarterly sales information by country for three years. The data that appears in a cell in the PivotTable report represents the sales of all products for a given country during a given quarter. But you may want to look at the sales numbers for just one particular product. Assuming that your data source contains a ProductName field, you can add that field to the page area.
In the row and column fields, you can look at data for any number of values. For example, if the Country field is in the column area, you can look at data for one country, or ten countries, or all of the countries listed in the database by clicking the drop-down box on the Country field and selecting or unselecting the countries you're interested in. In a page field, however, you can look at data either for one value or for all values. For example, you can view data in the PivotTable report for all products, or you can view data for one product at a time.
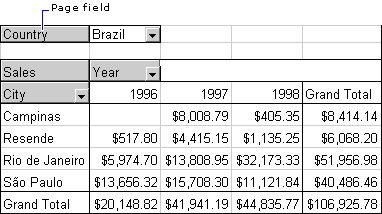
Page fields are advantageous when you want to look at data in the PivotTable report for only one value in a given field. For example, suppose you want to view only sales for Brazil in the PivotTable report. If you add the Country field to the page area, and add the City field to the column area, you can select Brazil from the Country field's list to view sales data for Brazil by city, as shown in Figure 15.4.
Note If you compare figures 15.3 and 15.4, you may notice that the ProductName field appears as a page field in Figure 15.3 but not in Figure 15.4. Nonetheless, the data area in Figure 15.4 displays sales figures for all products, even though the ProductName field is not included in the PivotTable report. If you include a page field and set its value to "(All)", the effect on the PivotTable report is the same as if you had omitted the page field in the first place. In other words, adding a page field to a PivotTable report does not affect the data that is displayed in the report unless you specify a value from the page field on which to filter the data.
Figure 15.4 PivotTable Report Showing Sales Data for All Products in a Single Country for Multiple Years
Note If you hide PivotTable items in a row or column field, and then move the field to the page area, the hidden PivotTable items will not appear in the drop-down list for the page field.